
July 23, 2025
This post was originally published on the GC Wealth Project website. For more content that explains how to create data visualizations and use the site’s many features, see the News section. Max Longmuir is a 2023–2025 Stone Center postdoctoral scholar whose research focuses on household finance, labor economics, and distributional economics, with a special concentration on wealth inequality.
By Max Longmuir
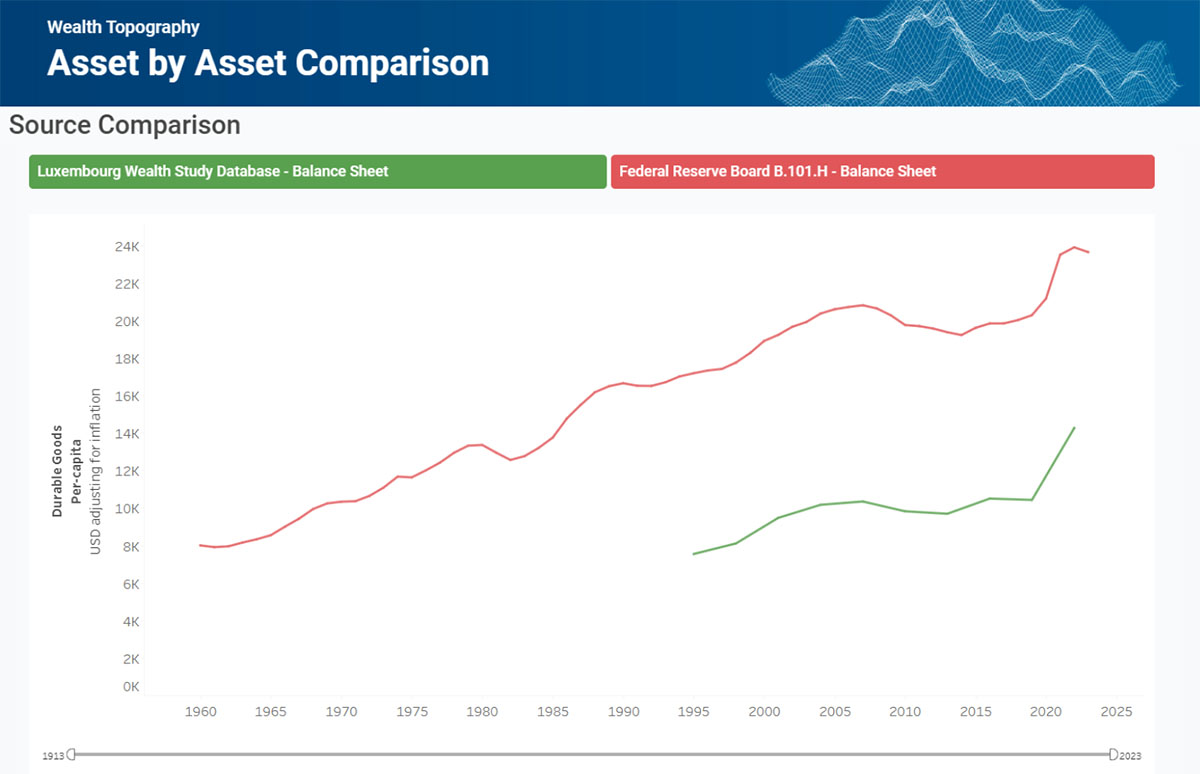
Figure 1
Do consumer durables and offshore financial wealth matter for understanding household wealth distribution?
In this post, we shed light on two types of wealth that go beyond the baseline definition found in national accounts. We focus on consumer durables and offshore financial wealth: both are included in the GC Wealth Project’s Wealth Topography section, which gathers data on household balance sheets.
These asset types are generally excluded from conventional wealth statistics but matter greatly for understanding the distribution and composition of wealth across households. While consumer durables are broadly distributed and especially relevant for households in the lower and in the middle part of the wealth distribution, offshore accounts are typically concentrated among the very top.
Consumer Durables
Consumer durables can be described as a specific wealth type. Even though they are defined in the Appendix of the System of National Accounts (SNA 2008), they are not necessarily included in the standard wealth definition. According to the SNA, a “durable good is one that may be used repeatedly or continuously over a period of more than a year, assuming a normal or average rate of physical usage” (SNA, 2008, $9.42). In other words, consumer durables are consumption goods, such as cars, washing machines, or televisions, that are consumed over a lengthy period. For many households, these items represent an important share of their total assets.
Figure 1 shows the total value of durable goods in the United States based on Federal Reserve Board data. In 2023, durables were worth close to $23,000 per capita, a figure that has increased substantially over recent decades. This level is comparable to the $27,000 per capita in fixed capital held by personal businesses.
To complement this view, we also include data from the Luxembourg Wealth Study Database (LWS). However, it is important to note that LWS captures vehicles only as consumer durables, and therefore reports lower aggregate values compared to the broader Fed definition. As a result, comparability across data sources depends on which goods are included. Survey-based wealth modules increasingly cover durable goods, but definitions still vary.
Offshore Financial Wealth
Another important, but often overlooked, form of wealth is financial assets held in offshore accounts.
The GC Wealth Project includes two key sources of data on offshore wealth:
- Vellutini et al. (2019) provide estimates of offshore wealth held by individuals in major economies, along with related estimates of international tax evasion, particularly for EU member states.
- The Atlas of the Offshore World (EU Tax Observatory) extends earlier work by Zucman (2013) and Alstadsæter, Johannesen, and Zucman (2018), using discrepancies in global investment statistics to infer the level of offshore holdings.
Offshore wealth is notoriously difficult to measure, since these assets are often structured specifically to avoid traceability. Therefore, measuring offshore financial wealth involves a margin of error, as Alstadsæter, et al. (2018) explain:
“We can have a sense of the global amount of offshore portfolio securities by looking at specific anomalies in global investment statistics. The equities, bonds, and mutual fund shares owned by households on foreign accounts are duly recorded on the liability side of the international investment positions of countries (the stock equivalent of the balance of payments), but not on their assets side. This causes a discrepancy between global portfolio liabilities and assets. […] Using these anomalies, Zucman (2013) estimates that the equivalent of 10% of the world’s GDP is held offshore”.
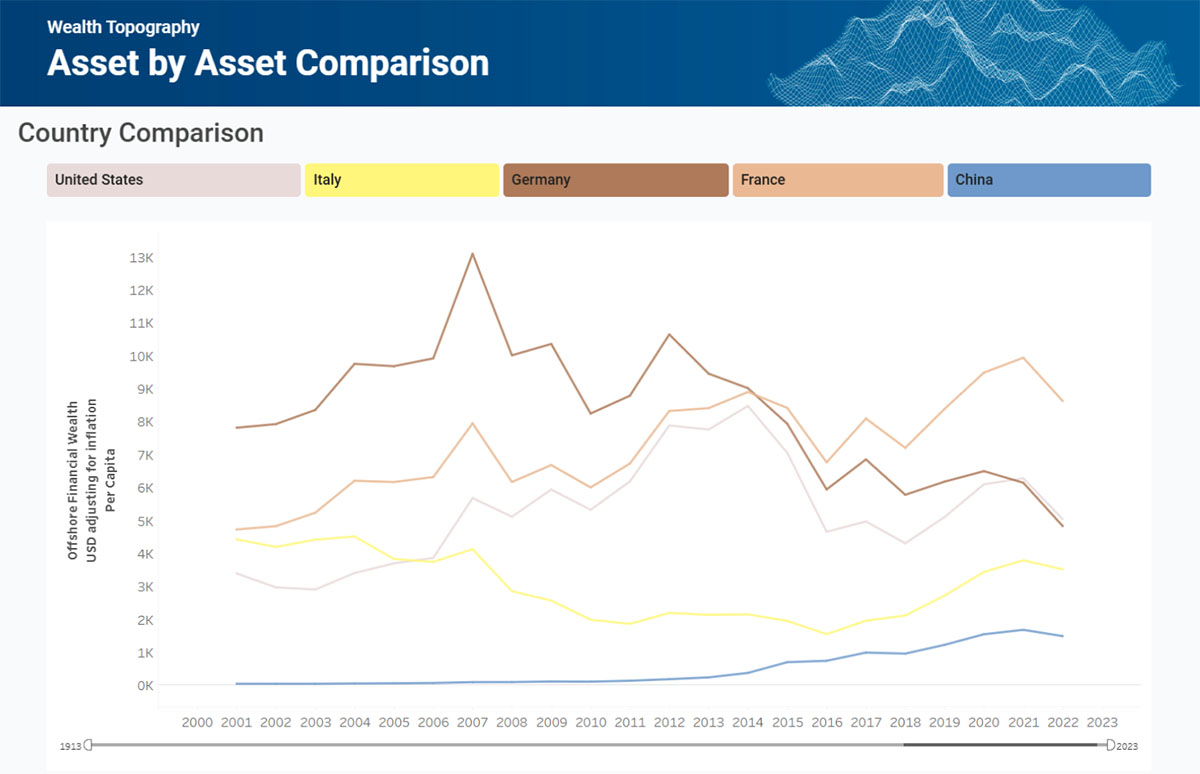
Figure 2
The Wealth Topography section of the GC Wealth Project allows us to compare and visualize the amount of offshore financial wealth held in tax havens abroad. Figure 2 visualizes data from the Atlas of the Offshore World for five countries. The graph shows a notable decline in offshore financial wealth per capita in Germany, France, and the United States during the mid-2010s. In more recent years, this has stabilized in Germany and the United States at $5,000, while in France it has increased to around $8,000 per capita in more recent years. In contrast, Italy and China have experienced an increase in offshore wealth, reaching $3,000 and $1,000 per capita respectively in 2022.
These two examples highlight the limitations of relying solely on national accounts to assess wealth. Durable goods are especially relevant at the lower end of the wealth distribution, while offshore accounts are concentrated at the top. Both require careful consideration when interpreting or designing wealth measures.
How would I access and modify these graphs?
If you’d like to play with the data yourself, you can find the tools to do so in Asset by Asset Comparison in Wealth Topography section of our dashboard. There, you can visualize and download the data for these graphs or modify the variables to further explore this section of the data warehouse. To recreate these figures specifically, follow the instructions below.
For Figure 1, select the following settings in the Source Comparison
- Country: United States
- Asset, Debt, or Wealth Type: Durable Goods
- Currency & Prices: USD adjusting for inflation
- Unit: Per Capita
- Sector: Household Sector
- Source: All Selected
For Figure 2, select the following settings in Country Comparison:
- Country: China, France, Germany, Italy, United States
- Asset, Debt, or Wealth Type: Offshore Financial Wealth
- Currency & Prices: USD adjusting for inflation
- Unit: Per Capita
- Sector: Household Sector
- Source: Atlas of the Offshore World
You can also see these options displayed in the animation below:
