October 19, 2026
Stone Center Director Janet Gornick delivered the keynote address, “Cross-National Inequality Data and Research, 1983–2026: The View From Inside LIS,” at this year’s Atkinson Conference on Economic and Social Inequality. The conference, which took place at Nuffield College, Oxford, in September, was named in honor of Sir Anthony (Tony) Atkinson (1944–2017), one of the most influential scholars of inequality. Atkinson served as the board president of LIS, the cross‐national data archive and research center located in Luxembourg, from 2012 to 2017.
Gornick served as the director of LIS — formerly known as the Luxembourg Income Study — from 2006 to 2016. Her presentation gives an in-depth, personal view of the development and early years of LIS, when it was one of the only sources for cross-national data on income and income equality, to LIS’s role in the world of inequality research today. The following transcript, based on a recording of her lecture, has been lightly edited for clarity. Part II and Part III of her presentation will be posted in the coming days.
Let me tell you what I’m going to do today. Zach Parolin reached out to me some months ago and asked me to give a keynote here and I asked what I should talk about. We had a back-and-forth and agreed that I would present an overview about inequality: “What do we now know about socioeconomic inequality? What are the unanswered questions?” So, I started an outline of a lecture, one that would cover accumulated research on earnings, income, and wealth — levels, trends, drivers, and consequences.
Then Zach sent me the participant list for this meeting. And I thought: “Well, that’s a total fool’s errand — to be relating what we know about socioeconomic inequality to a room full of inequality scholars, many of whom produced the work that I would be synthesizing, and the rest of whom would be familiar with it.”
So, I stepped back and thought: “What could I do that’s different and unusual and perhaps unique to me?” What I decided to do is to tell a story, one that I would characterize as part intellectual history (although that’s a bit lofty) and part memoir. Thus, the revised title: “Cross-National Inequality Data and Research, 1983 to 2026: The View from Inside LIS.” Most of you know what LIS is — and, for those of you who don’t, it will become clear as I go along. I’m going to give a brief description.
The premise of my story is that I’ve worked with LIS closely for 36 years, from 1990 until today. That has given me the privilege of having a front row seat, one from which I witnessed the development of LIS and, at the same time, the enormous growth of other databases and projects which many of you are familiar with. So, I’m going to tell this story — clearly leaving aside a lot of detail — about many of the changes that have taken place in the world of data and research since the 1980s.
I have held many roles at LIS. I started on the staff and, after that, wore different hats. I ended up serving as director from 2006 to 2016. In any case, I was involved before being director and I’ve remained involved after. I think it’s fair to say that, if it happened at LIS, I either saw it or I know about it. So that’s the basis of the story that I’m going to tell today.
Let me go ahead and preview my main punchline, one I hope I don’t beat to death as I go along. When LIS was launched in the early 1980s, it was nearly alone in providing cross-national data on income and income equality, certainly at the microdata level. At the same time, the methodological toolkit that was in place was rudimentary and the community of institutions available for collaboration was minuscule. Now, all these years later, of course, the world has changed utterly. The lack of data and resources that LIS’ founders had to work with in the 1980s has been replaced, over time, by a mountain of data, a vastly changed methodological landscape, and an enormous body of scholarship. The volume and diversity of all of this has created new challenges, and I’m going to close by raising some of those new challenges.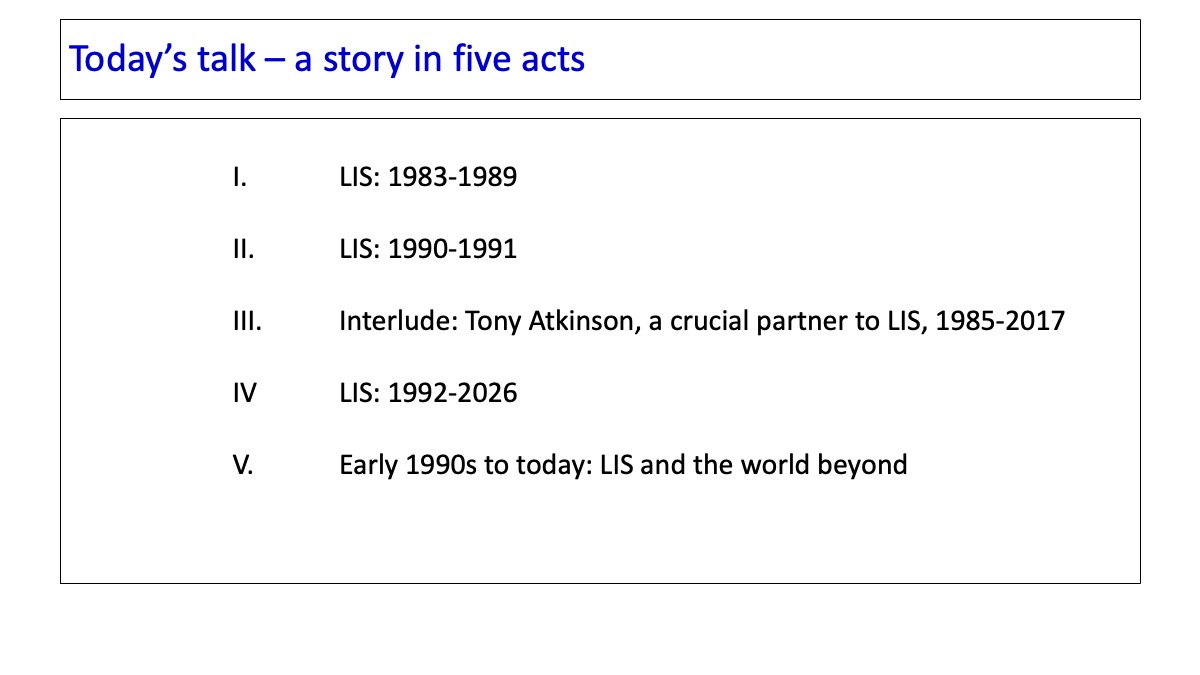
I’m going to tell this story in five acts. You can see them here. I’m going to tell it mostly chronologically, but I will take a break in the middle to talk about Tony Atkinson, who was a crucial partner to LIS for many years, going back all the way to 1985. I’ll go back and forth a bit — like flashbacks in a movie.
So, 1983 to 1989.
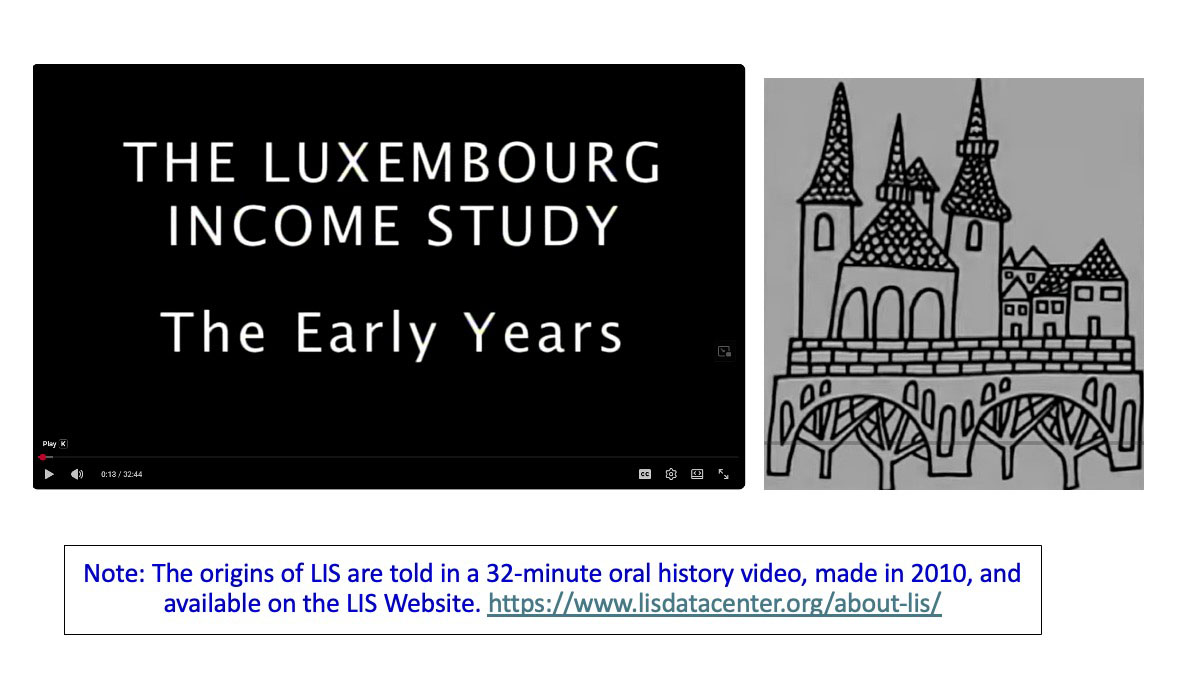
Let me first note that — and some of you may have seen this — in 2010, I and some others, including Markus Jäntti, made a video presenting an oral history of those early years at LIS in the 1980s. We did that because it was a remarkable time in terms of data, technology, and research, and we wanted to preserve it.
We interviewed six people who built LIS in the 1980s. I did the interviews. We have six hours of interviews, which we edited down to a 32-minute video. The video relates the tale of the founding of LIS in vivid terms. I’m going to give you a five-minute version of it now and, if any of you are interested, the video is posted on the LIS website.
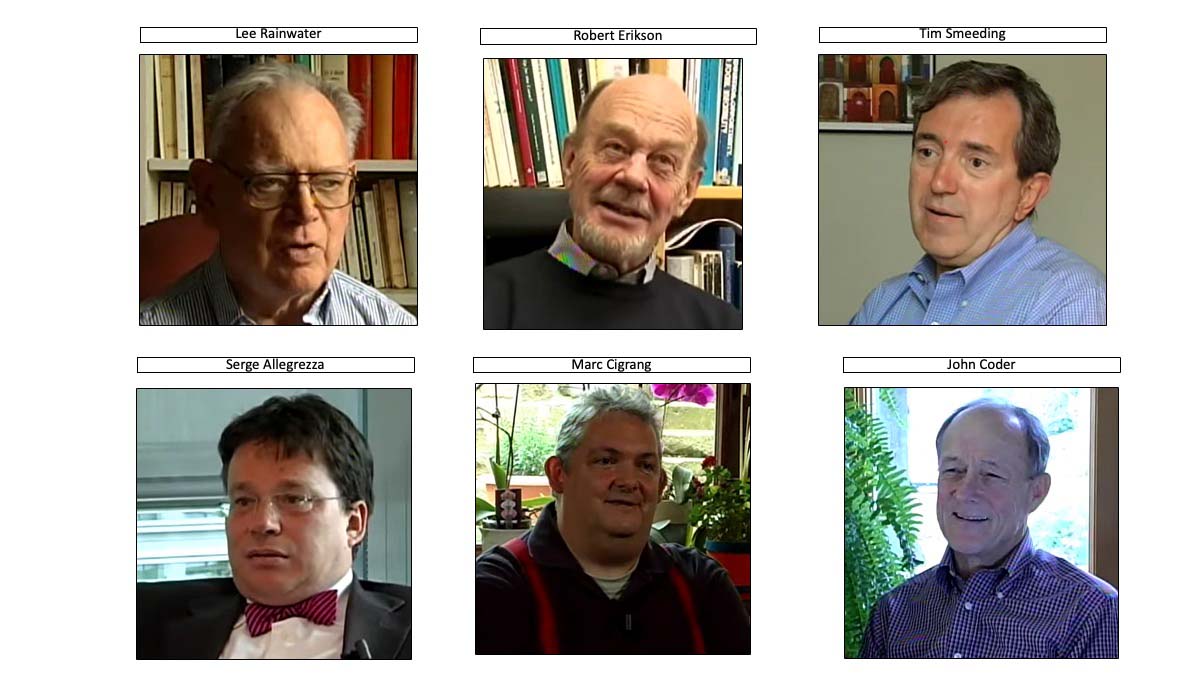
These are the six people we interviewed. On the upper left, you can see Lee Rainwater, the American sociologist, and to the right of Lee, Robert Erikson, the Swedish sociologist; they were two of the founding team that conceived of LIS. Soon after, they brought in Tim Smeeding, on the upper right, an American economist who, with Lee, built LIS. Lee and Tim then ran it for 23 years. Below Tim is John Coder, who Tim brought over to Luxembourg; John was on loan from the U.S. Census Bureau to help build the cross-national template. I’m going to come back to this in a few minutes and relate the development more systematically.
Two Luxembourgers joined as well. To the left of John is Marc Cigrang, who built LISSY, the remote-execution system. LIS is a very sticky place, people-wise. Marc still at LIS, overseeing LISSY ten software generations later. Finally, that is Serge Allegrezza on the lower left. Serge has also worked with LIS for many years; he was, in fact, co-author of LIS Working Paper #1. Serge went on to become director of STATEC, the Luxembourg National Statistical Office, a position that he held for many years. Marc and Serge were both instrumental in encouraging and persuading the Luxembourg government to let this kooky project get set up in Luxembourg.
So how did this all start?
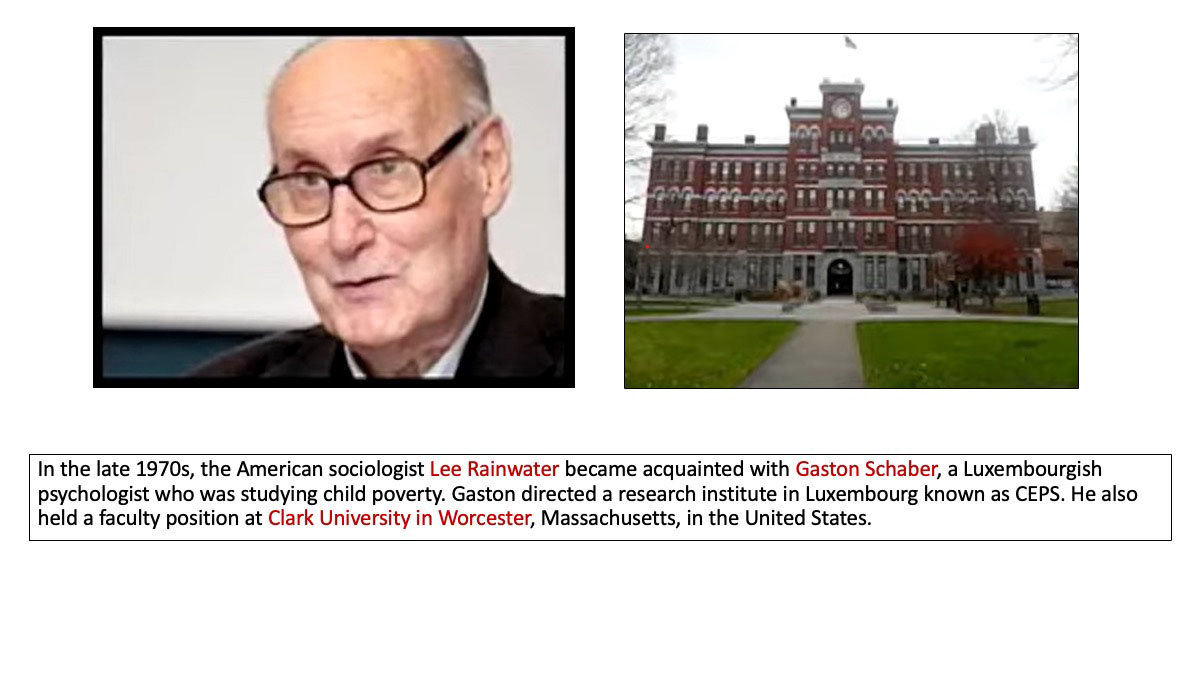
Back in the 1970s, Lee Rainwater, an American sociologist at that time well-known as an urban ethnographer, came to know Gaston Schaber, who is pictured here. Gaston was a Luxembourgish psychologist who was studying child poverty. He directed a research institute known as CEPS, which would later evolve into LISER. He also held a faculty position at Clark University in Worcester, Massachusetts, in the United States.
Gaston and Lee came together again, in August 1982, at a conference at Clark. The conference gathered poverty scholars and other social scientists from across several high-income countries. Robert Erikson was there as well. There was a side conversation, not part of the program, that took place where a group of researchers conceived of the idea of putting together a cross-national project on child poverty, one that would have as its anchor a high level of cross-country comparability. That was the idea: to produce some sort of comparative research.
After that conference, Gaston hosted two meetings in Luxembourg, both in 1983, to flesh out the idea for this cross-national research project. In attendance were social scientists, mostly poverty scholars, from seven countries; you’ll see which countries those were in a minute. Each of them had access to microdata of some sort from their home country. The original idea was to design a set of table shells — this was not uncommon in those days — and the researchers would go home and fill those tables. They would fill them, following standardized guidelines: the sample characteristics, the income definition, the poverty threshold, and so on. They would populate these tables so that they’d be nicely comparable. There would be one set of results from each of these seven countries; those would be sent to Luxembourg to be merged into some sort of a report.
At those first meetings in 1983, a monumental decision was made, one that had little precedent and one that would become the spine of LIS: they decided that, instead of harmonizing the tables, they would harmonize the microdata. So, the idea was that the actual microdata would be sent to Luxembourg and somebody would create a cross-national template, that is, a common variable list. It would have to be created and designed, with a set of rules, and all of these original microdata would be ex post harmonized into the LIS template. That’s what took place then, and that’s what takes place now — although on a much larger scale.
Once it became clear that the project was getting off the ground, Gaston raised some money from the Luxembourg government and secured modest office space.
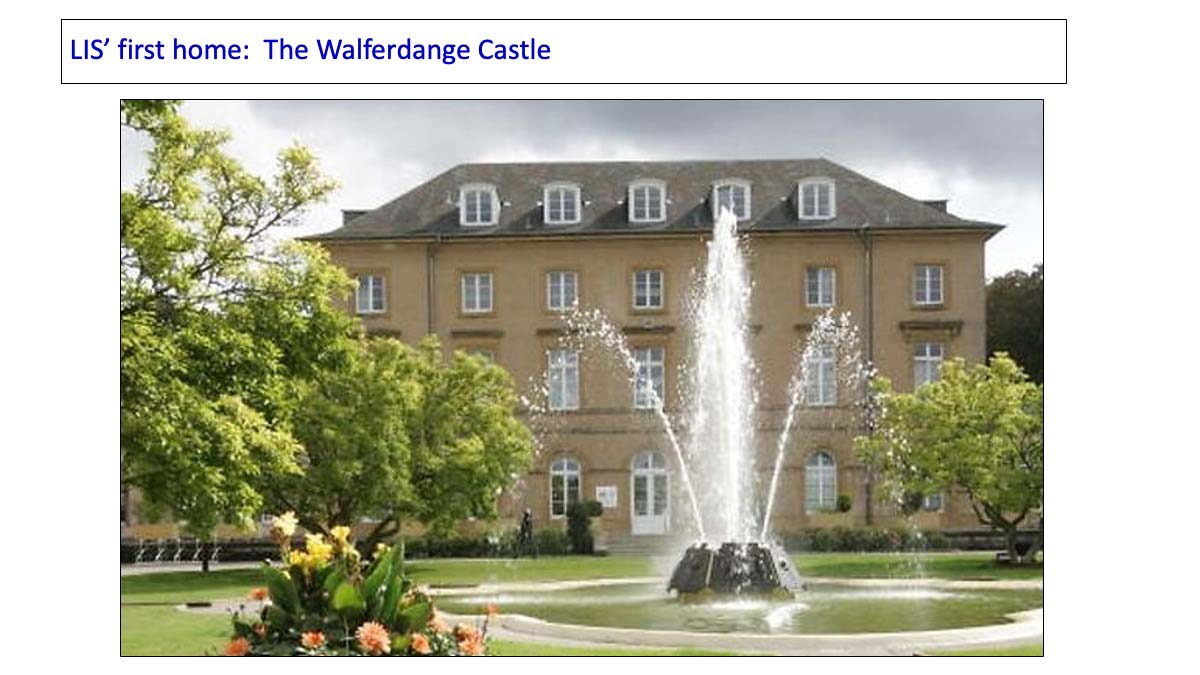
With that money, Tim Smeeding was hired, and the project moved to its first home, the Walferdange Castle, which some of you have visited. It was built in 1824 and is still in place in Luxembourg, although LIS is no longer located there. The LIS office was in one room, just behind the fountain. So that was LIS’ home in the early days.
I want to pause and say something about the name, because it’s created so much confusion over the years. When this project first took off — Tim tells this story in the video — they said, “Well, we need to give this thing a name. We’re in Luxembourg, it’s about income, let’s call it the Luxembourg Income Study.” And that name lasted for many, many years. And, of course, that was problematic because, after the very beginning, it wasn’t actually a study. It became a database and a research institute, with a Working Paper series, visiting scholars, and trainings, and more. The name became increasingly confusing. Fifteen years later, we would get a phone call from a journalist who would say, “Well, what were the findings of the study?”
Eventually, I became director and, especially when I was out gathering data or raising funds, I would say, “Well, it’s not about Luxembourg. It’s not really about income. And it’s not a study. Otherwise, it’s a great name.” So, we rebranded in 2010 — with permission from our colleagues in Luxembourg. They wanted us to keep the word “Luxembourg.” We renamed the institution: “LIS: Cross-National Data Center in Luxembourg” — and that’s the name today.
But what we also did, with respect for history and to not confuse the world entirely, is we retained the name, the “Luxembourg Income Study” and affixed it to the database that contains the income data. We have stayed with that formula for the later databases, including the Luxembourg Wealth Study and, soon, the Luxembourg Consumption Study. We have continued to use that formulation even though it makes no more sense now than it did back then. Of course, a big part of the tale of LIS is that, when the original group came together in the early 1980s, they never imagined, never in a million years, that what they were creating was going to be alive for 43 years. No one imagined that. That part of the history is vividly told in the video.
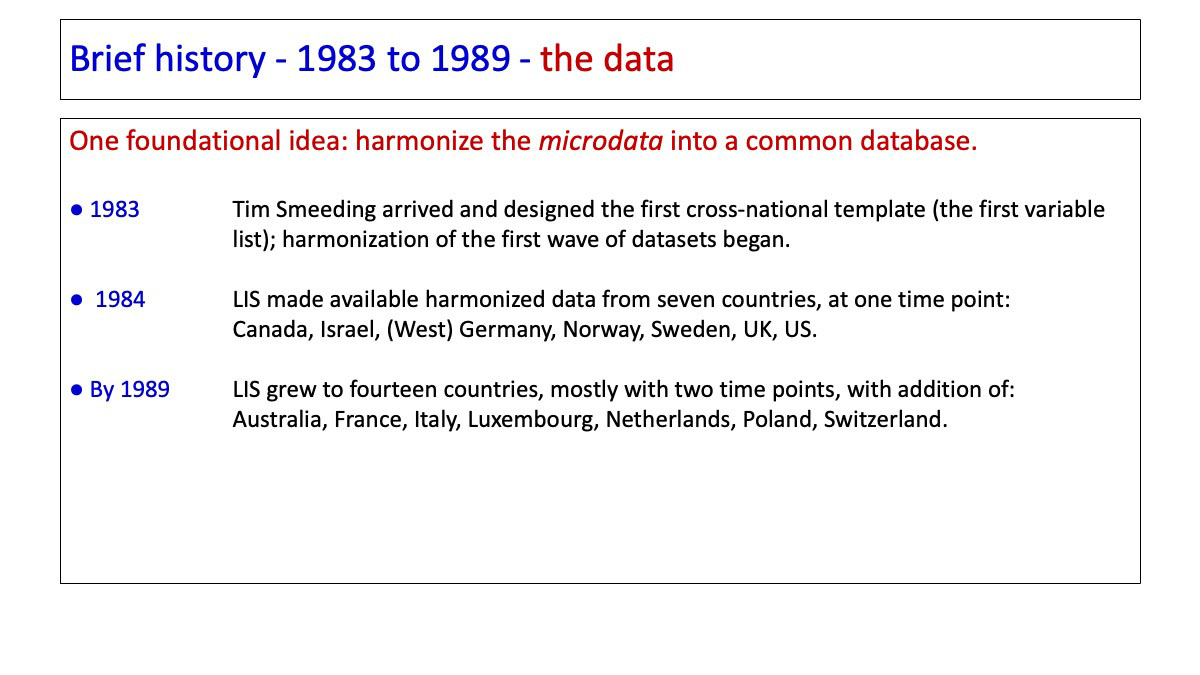
Now I’m going to talk about that first decade, the 1980s, a time also famous for rising inequality, and tell you what took place at LIS. Tim Smeeding arrived in 1983 and designed the first cross-national template, that is, the first variable list. The datasets arrived and he began to harmonize the data. The template was largely based on the U.S.’s Current Population Survey — the CPS variable list — because that’s what he knew best. That turned out to be a good decision, because the CPS is especially comprehensive, but at times a problematic one because many of the datasets from other countries were, and are, much different.
They worked quickly. In 1984, LIS made available the harmonized data from these first seven countries; you can see the list in the slide. Then LIS grew; by the end of the decade there were data from fourteen countries. They were all high-income countries, except for Poland, which was then middle-income. LIS grew impressively quickly. Tim spent much of his time running around the world, persuading reluctant national statistical offices to give this project in Luxembourg their very valuable data. So, the first foundational idea — to harmonize the microdata — took hold.
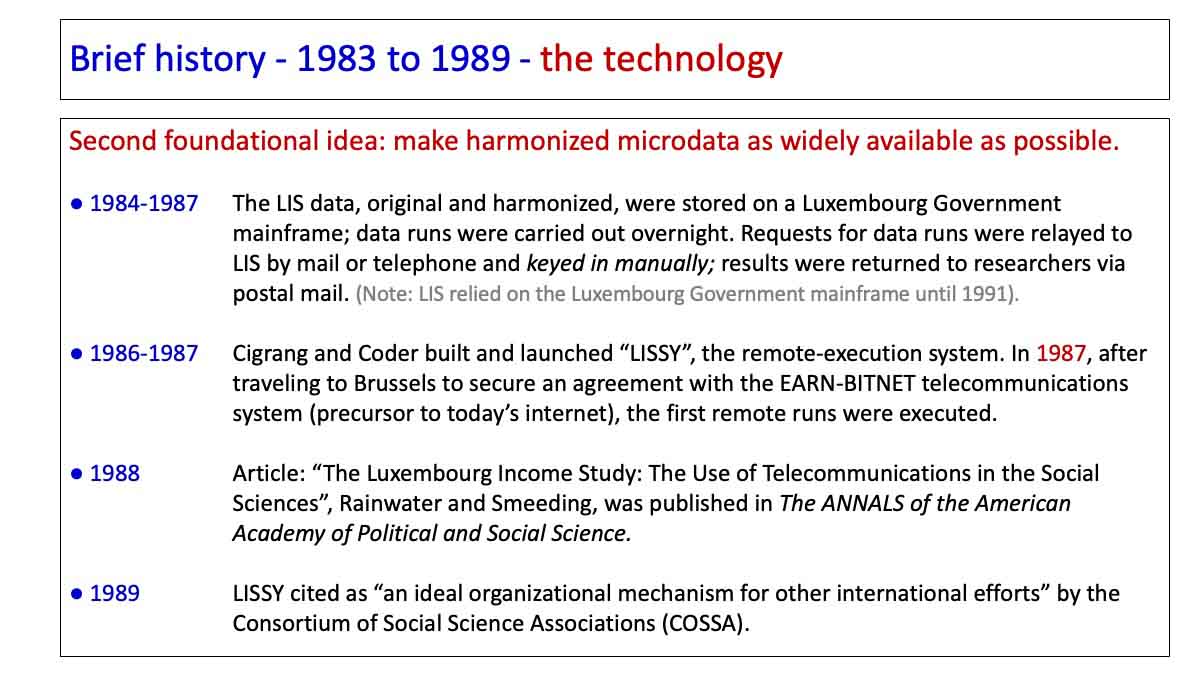
The second foundational idea, which was crucial — crucial enough that I want to linger on it for a moment — related to the technology. The remote-execution system is really at the heart of LIS. It was then, and it is now.
Let me tell you how one executed a LIS data run between 1984 and 1987. There was a group of researchers already, mostly from across these seven countries. These researchers were sitting in their home countries. They didn’t have the data, of course, but they had the code book. They would pull out a piece of paper, put it in the typewriter, type the SPSS code, put it in an envelope, stamp it, and mail it to LIS. It would get to Luxembourg, and somebody working in conjunction with LIS — a man named Gunther Schmaus — would key the code in. Then the jobs would be run on the mainframe where the data were stored. (I’m going to come to the mainframe in a minute.) The results would be printed, put back in an envelope, stamped, and sent back. For those of you who’ve done LISSY runs, you know there is about a 60-second turnaround. Then it was about a month.
I do have to tell you that there was one other option that I know about. No one has documented how often this was used, but for some reason this was available. You could telephone the LIS office! You would tell them, “I would like to get poverty rates for this, this, and this country, for this year….” (This didn’t happen too often because long-distance calls were expensive). Then the process would start. A person in Luxembourg would key in the code. God help you if someone made a coding error. So that’s how it worked. Obviously, it was very rudimentary.
Between 1986 and 1987, Marc Cigrang came on board and was joined by John Coder, and they built, designed, and launched “LISSY,” which was extremely innovative. LISSY is the remote-execution system. The first version was named “LISSY 1.” (Well, Marc Cigrang calls the stamp-and-mail option “LISSY 1,” but the real “LISSY 1” was the first automated version.) It’s interesting to note that they wanted to build a remote-execution system based on ones that they had seen operating within a single building. The story is often told: Lee Rainwater used to write data runs at Harvard, in his office in William James Hall, and send them to a large computer six floors up. And they said, “Well, if he can send runs several floors up, why can’t we send them to Luxembourg?”
So, they put the system together. The internet didn’t exist yet, but its precursor, the EARN-BITNET Telecommunications Network, did exist. It was in the hands of IBM. Marc and the others drove to Brussels, and they persuaded the team at EARN-BITNET to allow them to use the telecommunications network; that was a crucial success. Then the remote-execution system was set up. Using the telecommunication system of EARN-BITNET, researchers could stay at home, write their runs, and send them electronically.
LISSY attracted quite a bit of attention. In 1988, Tim and Lee wrote an article: “The Luxembourg Income Study: The Use of Telecommunications in the Social Sciences,” and it was published in The ANNALS of the American Academy of Political and Social Science. I read it on the plane yesterday; it’s quite a piece of history. LISSY quickly began to win awards as a model for cross-national research.
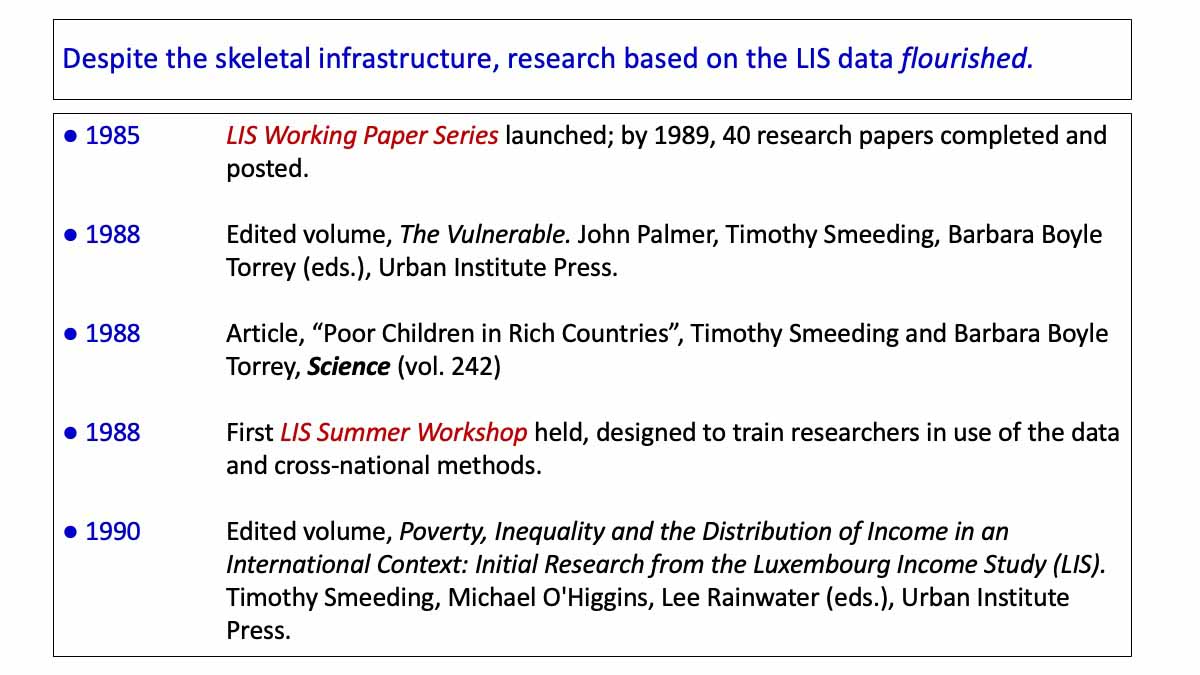
Now, it’s important to say that back in the 1980s — I will brag for them because I wasn’t there — despite the very skeletal structure, the lack of colleagues, the lack of knowledge, and the need to make it all up on the fly, they were remarkably productive on the research front.
In 1985, the year after the data were launched, they started the LIS Working Paper Series, and by 1989, there were 40 research papers completed by 47 different authors. (They were not all written by Tim and Lee, although that’s how people tend to remember it.)
In 1988, a book was published, The Vulnerable. The title reflected a theme that has long been central at LIS: thinking about vulnerable groups of people. It had only a couple of chapters based on LIS, but LIS got some attention.
I think one of the most astonishing pieces of LIS history was in 1988, when Tim and his colleague Barbara Boyle Torrey published a paper called “Poor Children in Rich Countries,” and it was published in Science. It was published in Science! And, basically, it’s a series of cross tabs. It’s not the kind of paper you would generally expect would be published in Science — but the data were so unusual and so unknown, that’s where it was published.
In 1988, they held the first LIS Summer Workshop, which started another activity that LIS has always considered central to its identity and purpose, and that is to train mostly young emerging scholars on comparative methods, and also to encourage people to use the LIS data.
By 1990, research based on the data was piling up and they published a volume that was entirely LIS papers, called Poverty, Inequality and the Distribution of Income in an International Context: Initial Research from the Luxembourg Income Study (LIS) — and it got some attention.
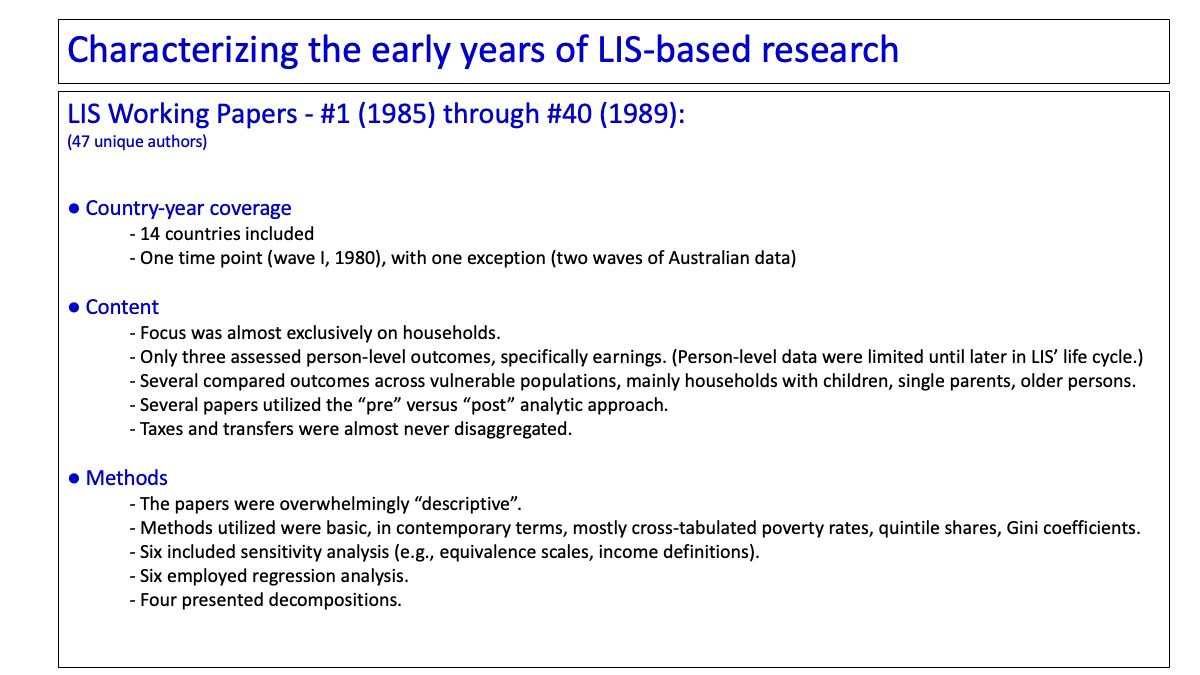
I went back last week and took a look at those 40 Working Papers. I was pretty familiar with them, but I wanted to check my memory, to see what was in these papers. Again, I suspect that I’m going to overkill this message — about how limited the work was in those days — and, soon, I’m going to shift from then to now.
When these first 40 papers were written, there were 14 countries included in the LIS Database, at just one cross-section, 1980. By the end of the decade, one of the papers — by Peter Saunders from Australia — included results from two waves of Australian data. Otherwise, these papers were entirely cross-sectional. The idea of studying trends was not on the agenda.
The focus was almost entirely on households. That unit of analysis grew out of the founding team’s interest in poverty, which is almost always considered a household-level concept. Only three papers in the first decade used person-level data. They were all on earnings, two on gender gaps and one focused on human capital. This emphasis on households was linked to the overarching interest in poverty research, but it was also because the original template that Tim put together included very little person-level data. Later, when Markus Jäntti and I were there, the data team went back, pulled out, and harmonized — we call it “lissifying” — much more person-level data, going all the way back to the earliest waves of data. But at the time, there was very little there.
There was clear interest in vulnerable populations. Several of these papers focused on households with children, or the elderly, or those headed by single mothers. Several utilized the famous “pre versus post” approach. I think everybody knows what that is, looking at pre-tax-pre-transfer income versus post-tax-post-transfer income, which you can do in the microdata, and then calculating inequality or poverty using both income definitions, and interpreting the difference between the two, somehow calculated, as a proxy for redistribution. It’s a powerful and simple tool with advantages and disadvantages, as you all know; in any case, it was evident back in the 1980s. (Interestingly, I also noted that the taxes and the transfers were almost never disaggregated. That would come later.)
Summing up, the methods in those first papers were overwhelmingly “descriptive” — and I put that in quotes because I don’t even know what that word means anymore! (In my view, the world has gone utterly mad on this score. It seems that now every single journal article is required to include causal inference methods, but we’ll leave that commentary aside for now.) Those early LIS papers were descriptive, meaning that the methods were remarkably basic, especially in contemporary terms. Most of these papers included mainly crosstabs and frequency tables, mostly reporting poverty rates, quintile shares, and Ginis. Six included some sensitivity analyses; there was a lot of self-conscious interest in the data themselves. Six employed some simple regressions and four presented decompositions.
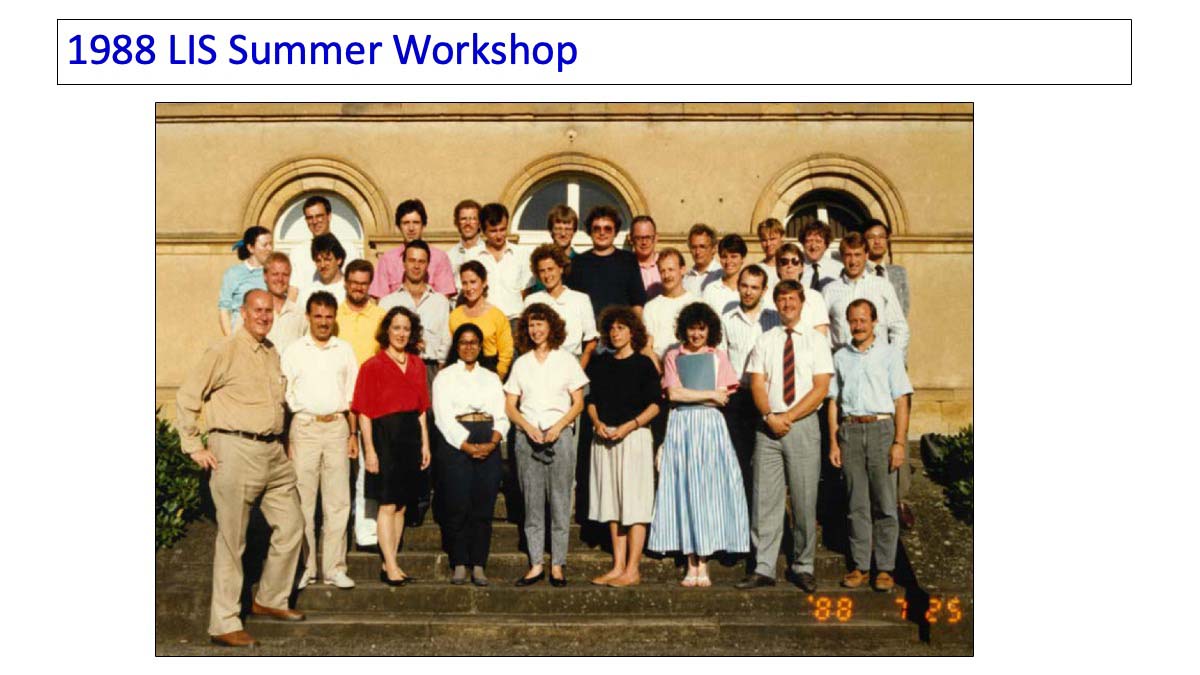
This is a photo of the first LIS Summer Workshop — held in 1988. Many of you here have attended a LIS Workshop, with some of you going back to the early years. In this photo, you will see at least two people many of you know; that would be Johan Fritzell and Joakim Palme. And, of course, Tim and Lee are there, in the back row — and Gaston as well in the front row.
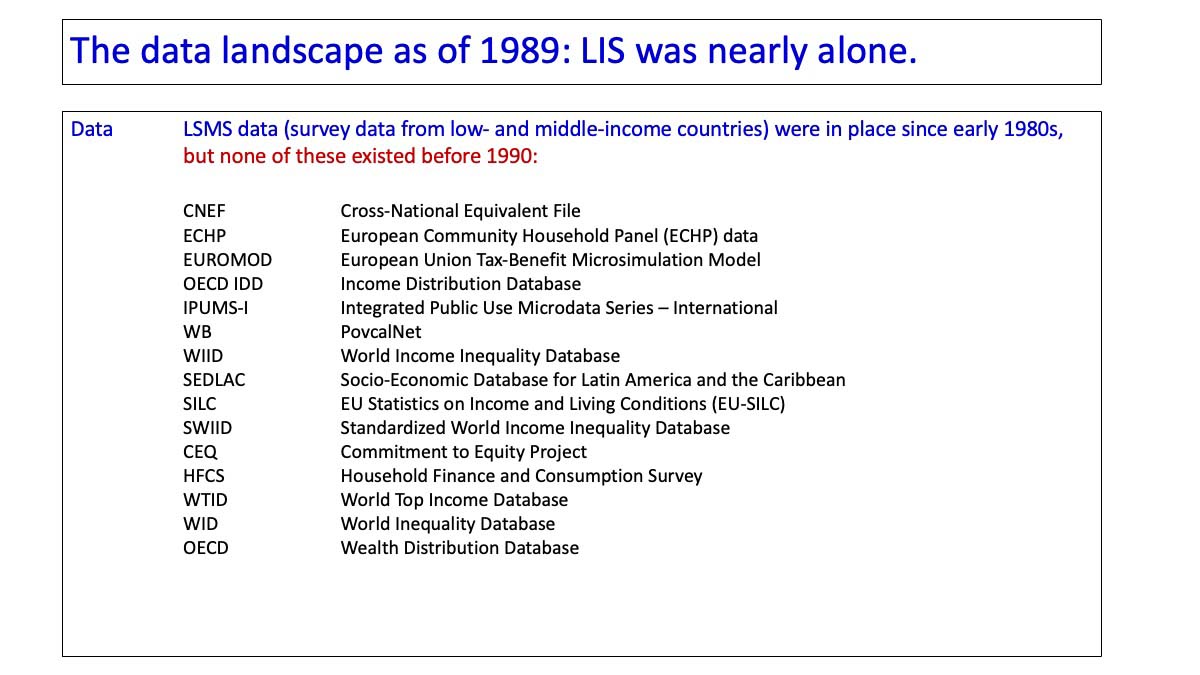
Now I want to say something about the “data landscape” back then. This is clearly a simplified story. Nevertheless, at the end of the 1980s, LIS was nearly alone. Here I want to point out something that most of you probably know, although perhaps not this systematically. All of these datasets, databases, and projects — and many of you know a lot of them — not a one of them existed. These are, of course, very varied, with different structures and contents.
In any case, there was no ECHP, there was no SILC, there was no Household Consumption and Finance Survey. There was no WIID, or the other WID, or SWIID. There was no EUROMOD or IPUMS-International. OECD had not yet launched their databases.
LIS was really alone, which had the advantage that we had open space to fill. But there was also the disadvantage that the LIS team and the data users had to, essentially, invent the methods used on the fly. There was little collective knowledge and few opportunities for collaboration.
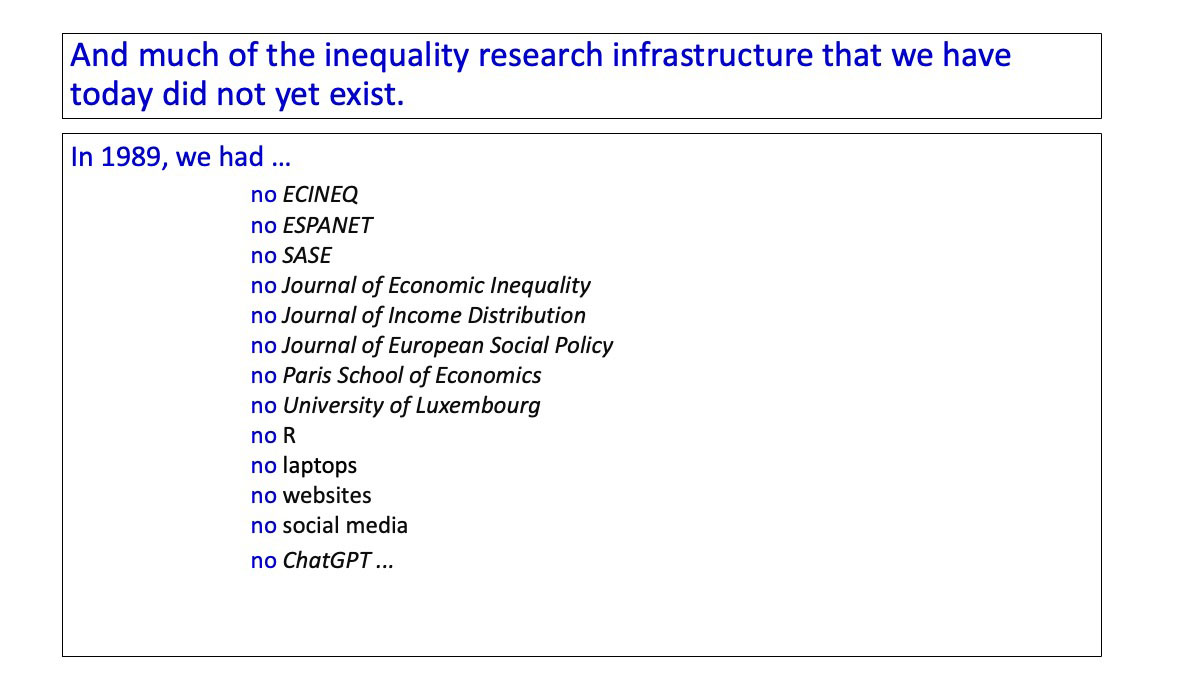
This is my final slide going back to what the world looked like then. In the U.S., we have this cliche of old people saying, “When I was a kid, we walked miles through the snow to go to school.” I worry that this is what this sounds like. But, it’s true, kids! Back in 1989, we had no ECINEQ, no ESPANET, no SASE, no Journal of Economic Inequality, no Journal of European Social Policy. There was no Paris School of Economics, no University of Luxembourg. There was no R, there were no laptops, there were no websites, there was no social media, there was no ChatGPT. It was a different world!
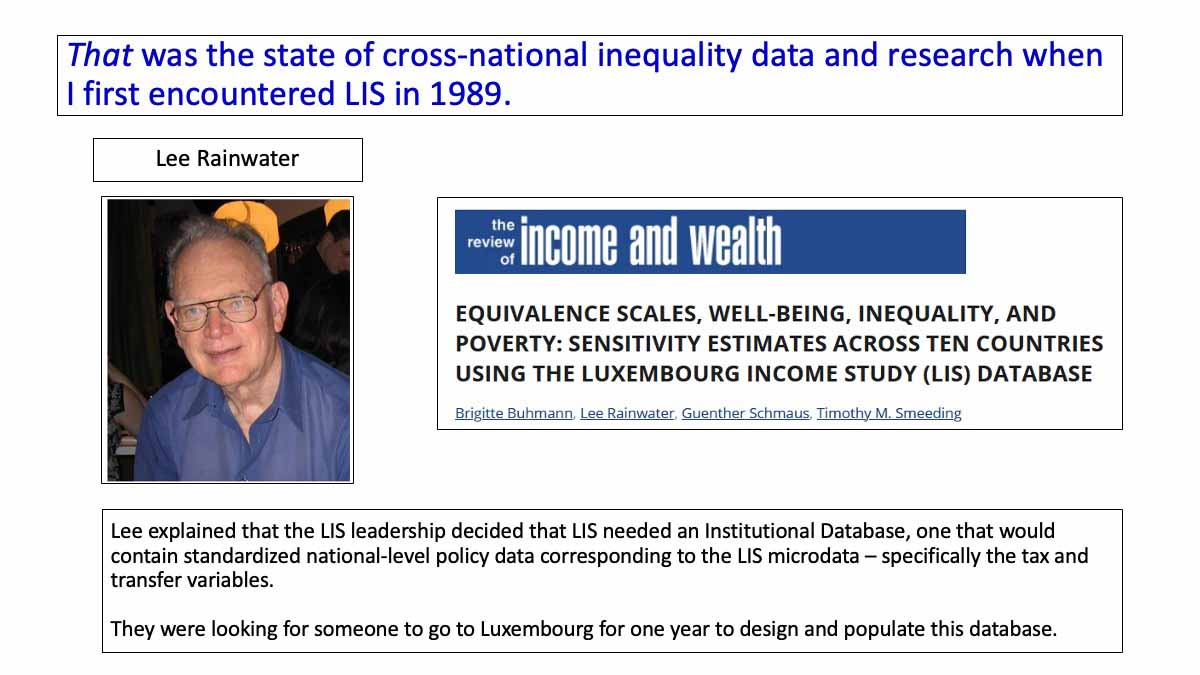
That was the world that I encountered when I first learned about LIS. This is how I became involved. Lee Rainwater was professor of Sociology at Harvard. I was a Ph.D. student in Political Economy and Government. I was looking for a dissertation topic and not finding one that really sang to me.
Although Lee was in Sociology, he was asked by the Kennedy School, the public policy school, to offer its first ever course in comparative social policy, and he needed a teaching assistant. To my everlasting gratitude, I was hired. The course began in September of 1989 and, a few weeks in, he assigned this paper. Now, despite all those other resources that I noted did not exist then, the Review of Income and Wealth was in place. This article had been published, on equivalence scales, with sensitivity testing carried out using the LIS data. We taught that article to, I must say, a lot of bewildered students. I, like them, had never heard of the Luxembourg Income Study. I’d certainly never heard of an equivalence scale.
A couple of weeks into the course, Lee pulled me aside and explained that the LIS leadership — encouraged by Tony Atkinson — decided that LIS needed an institutional database, specifically, a database that would record in some standardized fashion the rules, especially of the transfer programs, and to some extent the taxes as well, that were captured in the microdata. This this would enable researchers to consider policy features that were exogenous to the microdata, in contrast to policy indicators that emerged from the microdata using the “pre versus post” approach.
They were looking for someone to go to Luxembourg for a year, sort of mimicking what Tim had done, but at the national level — that is to locate and standardize policy data. I was studying comparative social policy, and I knew something about how social policies were structured, but not terribly much. Lee asked if I wanted to go to Luxembourg and take this job.

I also had no idea where Luxembourg was. So, I went home and, consistent with my tales about the low technology available back then, I pulled out my Atlas of the World — it’s still in my office — and I found Luxembourg. I thought, “Well, that looks interesting.” So, the next day, I went back to Lee and I said: “Okay, I’ll do it.”