October 20, 2026
This is Part II of Stone Center Director Janet Gornick‘s keynote address, delivered at this year’s Atkinson Conference on Economic and Social Inequality. The conference, which took place at Nuffield College, Oxford, in September, was named in honor of Sir Anthony (Tony) Atkinson (1944–2017), one of the most influential scholars of inequality. Atkinson served as the board president of LIS, the cross‐national data archive and research center located in Luxembourg, from 2012 to 2017.
Gornick served as the director of LIS — formerly known as the Luxembourg Income Study — from 2006 to 2016. The following transcript, based on a recording of her lecture, has been lightly edited for clarity.
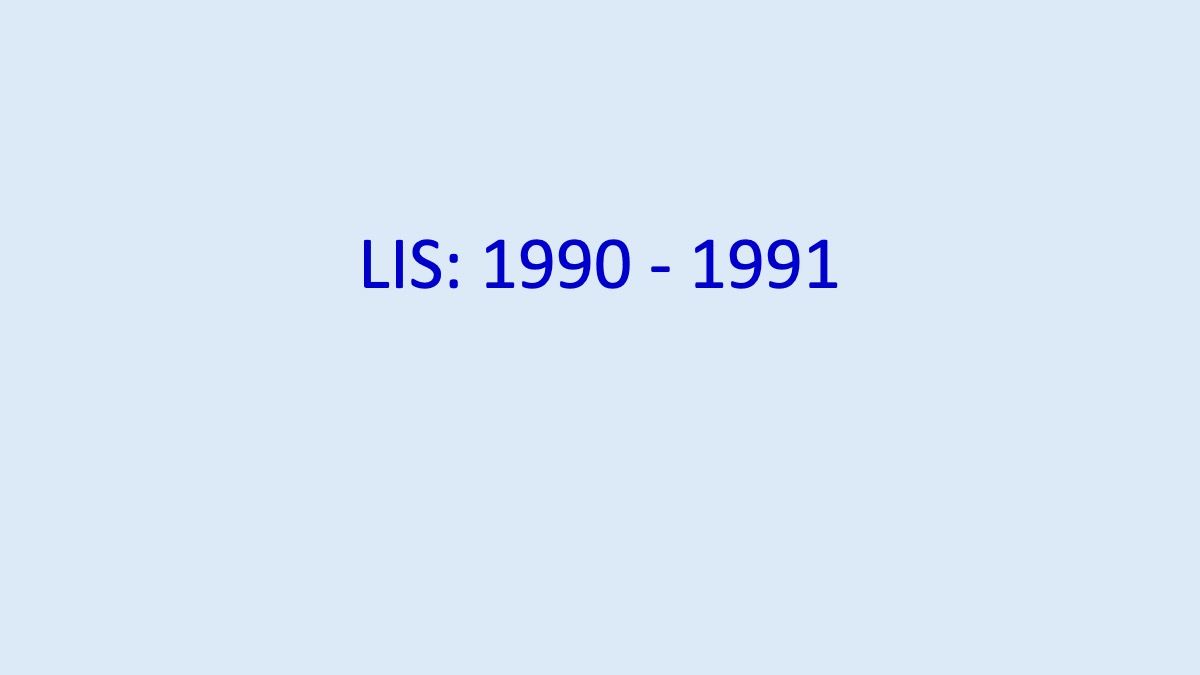
I had absolutely no idea what I was getting into.
In any case, Lee and Tim waited six months for me to finish my Ph.D. exams — and, in June of 1990, I moved to Luxembourg. I was supposed to stay for one year. That one-year stay turned into the better part of two years, and my connection to LIS turned into 36 years. It’s hard to reconstruct exactly how that happened, but that’s what happened.
So, I arrived at LIS and, much like when Tim arrived, I really didn’t know what I was going to do. I didn’t know where the data were going to come from, or what standardized social policy data would look like.
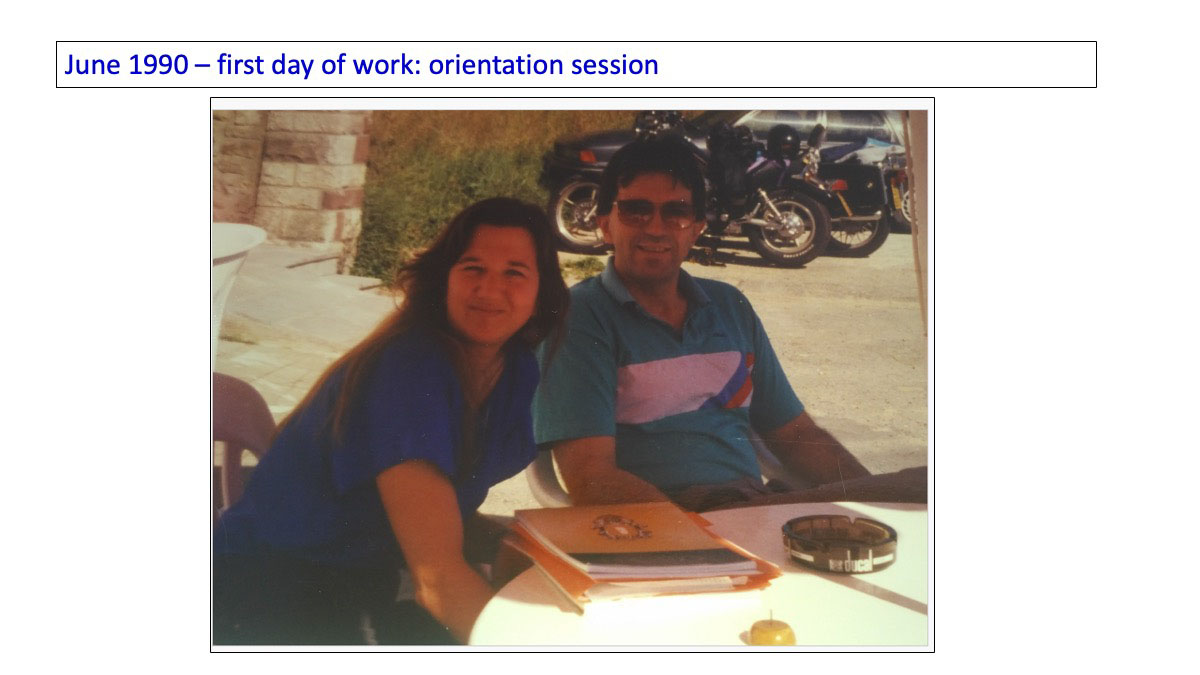
On the first day of my job, I was fortunate that Tim and Lee were both in Luxembourg because the 1990 Summer Workshop was taking place, and I was enrolled in it as a way to learn to use the microdata.
On my first day of work, I sat down with Tim Smeeding. That was my orientation session, in an outdoor cafe in Walferdange. I said, “Tim, I think I’m here to build a cross-national social policy database. Right? How am I going to do that? What are the sources?” And he said, “I have no idea. That’s why we hired you — to figure that out.”
Neither my question nor his answer were silly, because then there was no internet, and the first publicly available website would not be launched until the following year. There was none of the unbelievable amount of online social policy data that we have now.
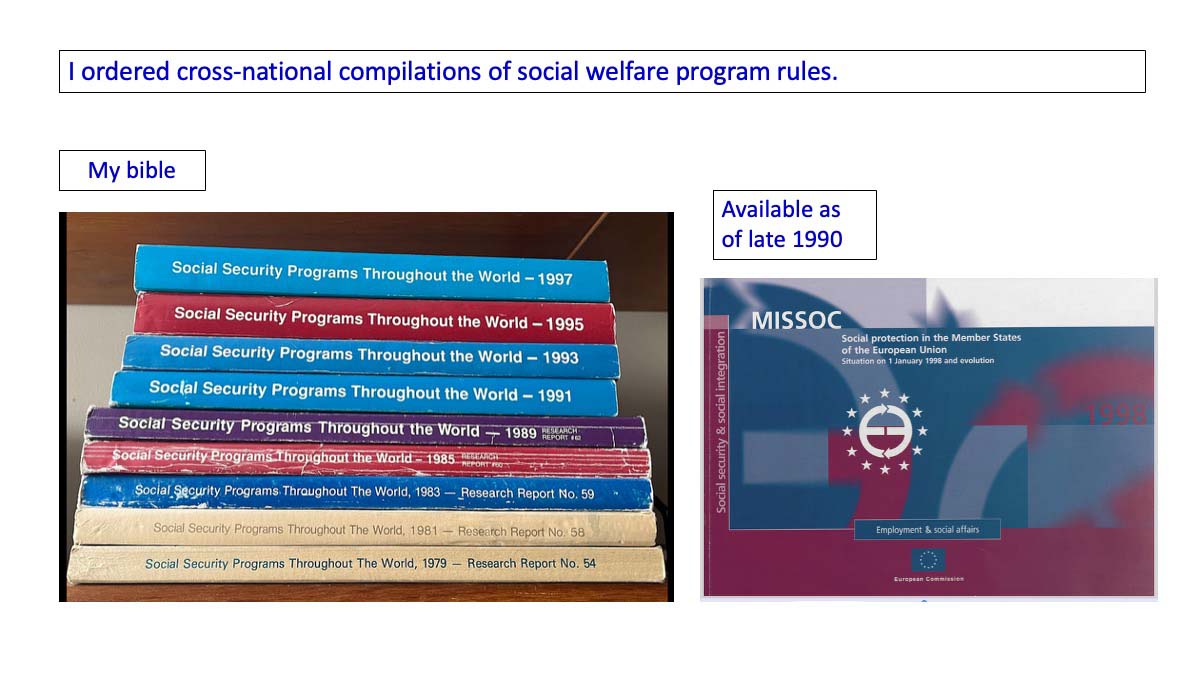
I did indeed figure it out, more or less. It turned out I had three options.
First, there was some series of printed manuals containing social policy rules. The volumes that you see on the left — Social Security Programs Throughout the World — were published by the International Office of the Social Security Administration in the U.S. These volumes included standardized tables, impressive ones, although not especially granular. Still, for every country, there were typically two pages, covering the major social insurance programs and, for each one, information about coverage, eligibility, benefit levels, duration, and something about the financing. This was the most important source that we had.
(These volumes are on a shelf in my CUNY office. I took this photo just before I left the U.S. I’m very sentimental! You can see how dog-eared the volumes are from the early years.)
During the course of my first year, the MISSOC tables were launched, covering social protection systems in the European Union. Some of you may know these. They were similar, in fact, to the Social Security Programs volumes, but much more detailed, especially regarding the financing side.
In both cases, I wrote a check, put it in an envelope, and ordered these volumes. Then I would wait about six weeks — and they would arrive, or they wouldn’t. Anyway, that is how I did my work.
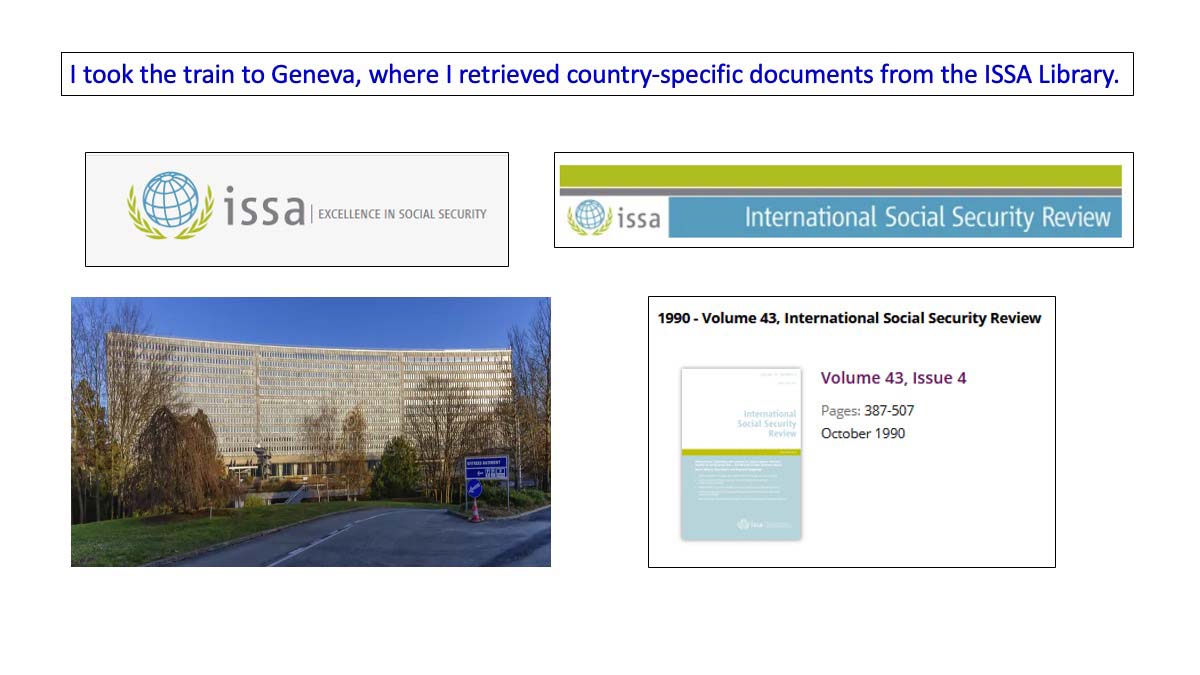
The second thing that I did was to get on a train and go to Geneva, to visit a library there based at the International Social Security Association, in the ILO building. ISSA had original social policy documents from all of these countries in big old file cabinets. And I brought with me Caroline de Tombeur from the LIS staff — some of you know her — and we carried bags of coins, literally. We photocopied what we needed and carried it back to Luxembourg.
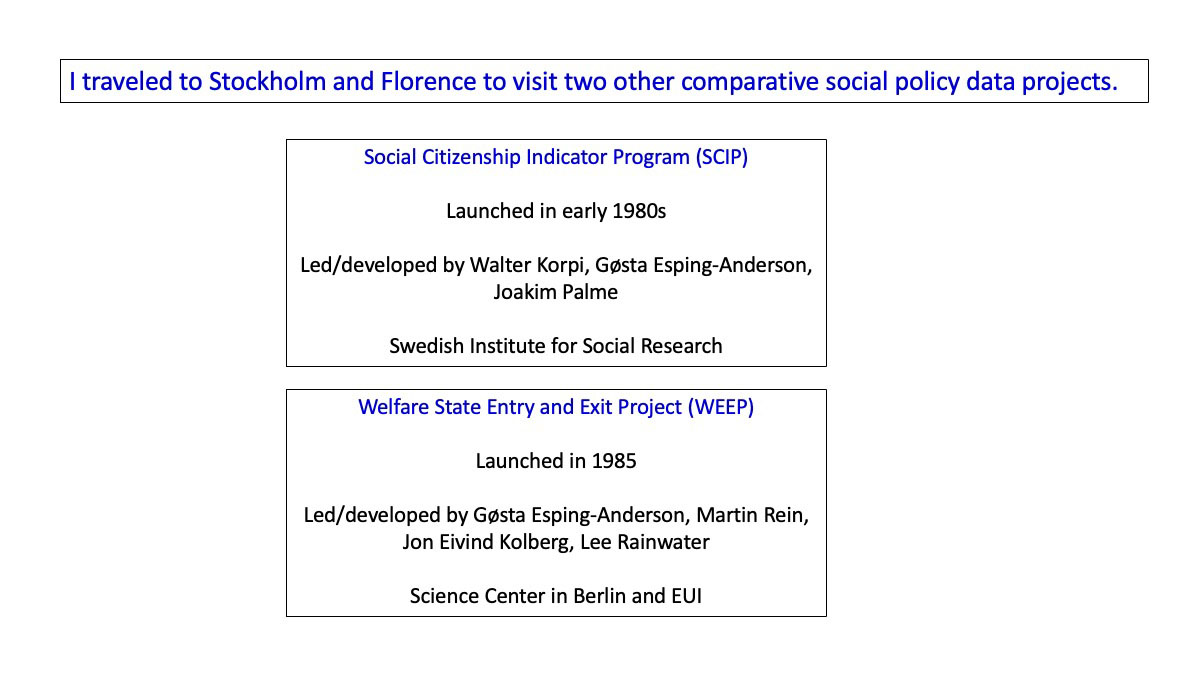
For the third phase of my data collection, I took two trips. I flew to Stockholm to visit the Swedish Institute for Social Research where I went to learn about the “Social Citizenship Indicator Program,” which was run then by Walter Korpi, with Ollie Kangas and Joakim Palme. They were also building a large database, but for a different purpose. It was not intended specifically to inform microdata findings, but it was similar nonetheless. I flew to Stockholm, which was very interesting. They were not at the time releasing the data, but I was able to see the structure.
Then I went to Florence to meet Gøsta Esping-Andersen, who was holding the WEEP data — the “Welfare Entry and Exit Project” — another cross-national social policy database, one that I would venture to say none of you have ever heard of. I got there, and what he told me was a cautionary tale, one that we took to heart. Gøsta was in his office, and he pulled out two boxes full of ratty paper filled with social policy data — this was the story of my life then, boxes — and he said, “Here, you can have this. We’ve given up. We’ve stopped doing this.” He said to me: “Be careful. The world is going to be littered with social policy databases that are started and abandoned because they are so labor-intensive and the world is constantly changing.” I went back to Tim and Lee and said: “We have to think about making this thing sustainable.” We took that to heart, and indeed ours actually did live for 20 years.
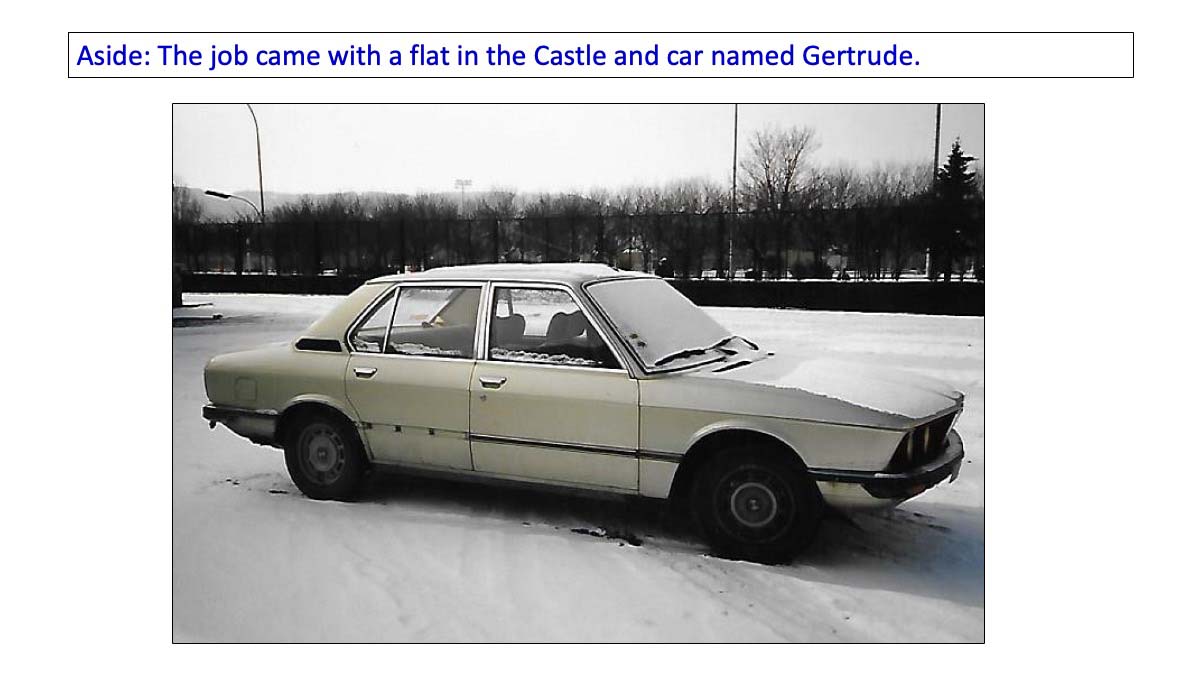
The job came with a flat in the castle and a car named Gertrude. I’m sure some of you remember her.
That was the first and last time in my entire life that I owned a car. Gertrude was the absolutely junkiest car ever laid eyes on in Luxembourg. I used to get heckled as I drove around; people would yell, “Get that thing off the road!” And Gertrude was finally deported. She failed inspection in Luxembourg and was deported to France.

Now I’m going to pause and change course — to talk about Tony Atkinson. Tony meant a lot to so many of us here today, and we are happy to have the Atkinson family here with us today — Judith, Sarah, Leila, and Evelyn.
Tony, as many of you know, was a crucial partner to several data projects. As Eric Beinhocker said at the conference dinner last night, Tony supported many, many projects, and LIS was one of them.
Tony attended the first LIS conference in 1985. Tim often told me how much they wanted Tony to come and how nervous they were because he knew so much. Was he going to be impressed? Would he think that what they were doing was important? And being done correctly?
Tim wrote this in one of his remembrances, after Tony died:
“Tony attended the first Luxembourg Income Study (LIS) conference — the one at which LIS’ founders held their breath, because, depending on what Tony and others said, the project would grow or die. Tony quickly became a strong supporter of LIS, helping the project in countless ways.”
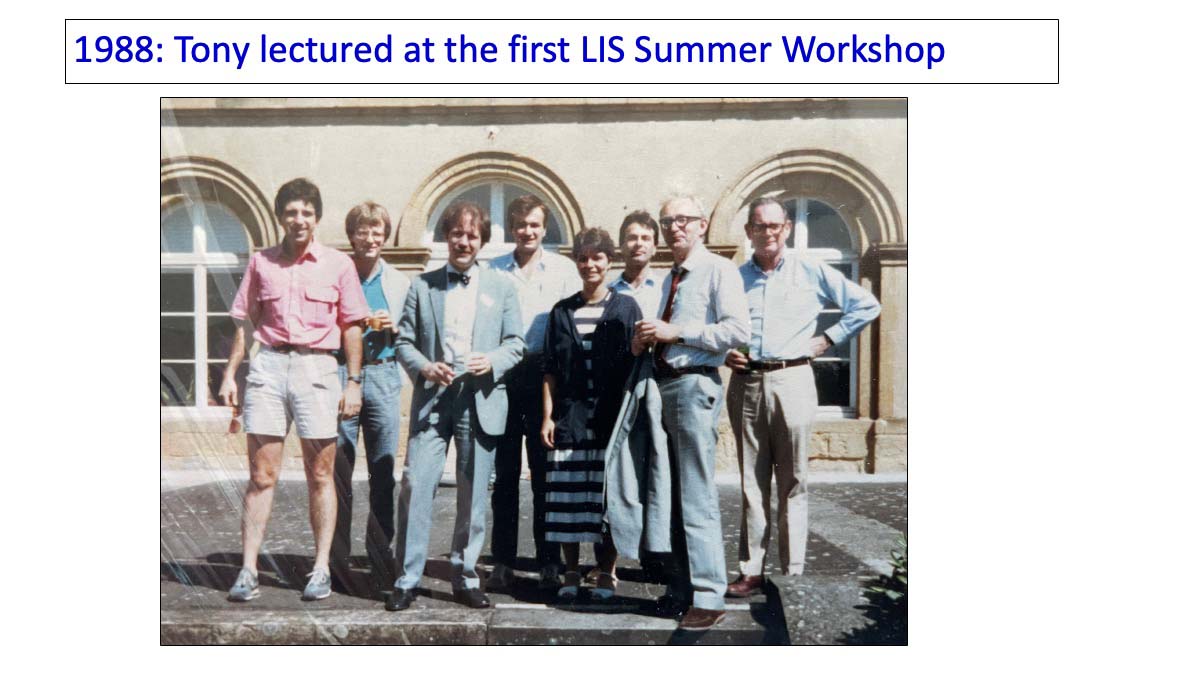
Tony came to the 1988 workshop and gave a lecture.
Tim told me that the students lined up to get his autograph.
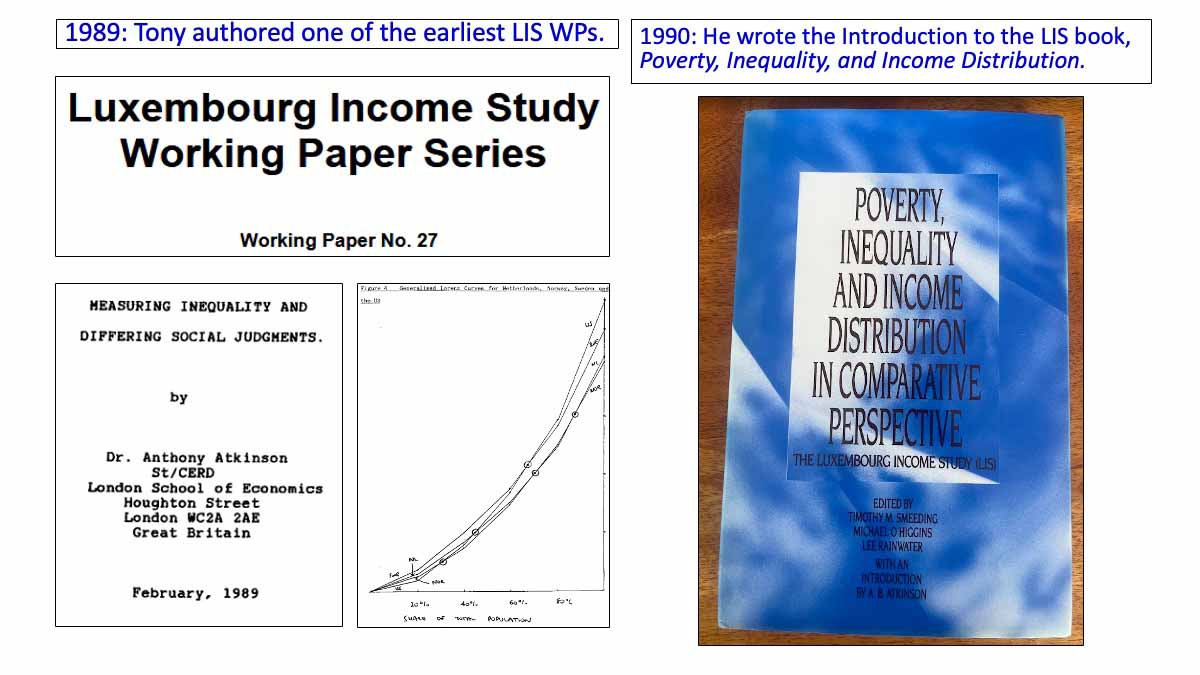
In 1989, Tony submitted his first paper using the LIS data, a solo-authored paper called “Measuring Inequality and Differing Social Judgments.” That was LIS Working Paper #27. Note that he drew the figures by hand. I love looking back at this paper.
In 1990, LIS released its first edited book entirely based on LIS data. This got some attention. Tony, of course, wrote the introduction, helping to float the project by writing about the importance of harmonizing and producing high-quality data, and praising survey data per se as an important instrument.
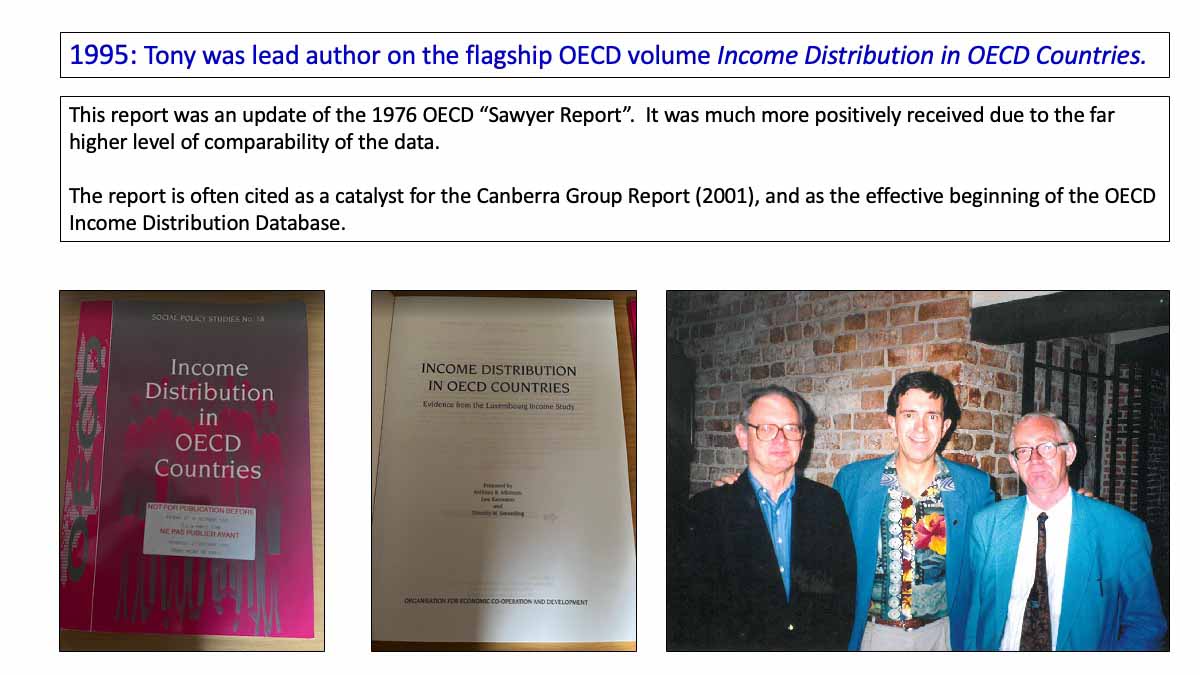
Probably the most important event in LIS’ first 15 years was the publication of this flagship OECD volume called Income Distribution in OECD Countries. Tony was the lead author, and it was coauthored with Tim and Lee. The report was an update of the 1976 OECD report known to some as “the Sawyer Report,” which actually had the same title. The Sawyer report presented measures of income inequality across countries. Many of the member states didn’t like it. It was heavily criticized, and rightly so, because the data really were not very comparable; they argued against many of the cross-national rankings and other findings. The idea behind this later report was to repeat that work all these years later, but now with comparable data, and Tony took the lead.
This report was hugely important at LIS and beyond. It is often cited as a catalyst for the Canberra Group Report in 2001 — which reported standardized guidelines, especially for statistical offices, about income measures — and as the effective beginning of the OECD Income Distribution Database.
I carried this here for today. On the front of the OECD report, you can see that it says: “Embargoed until 27 October 1995, 7pm Paris time.”
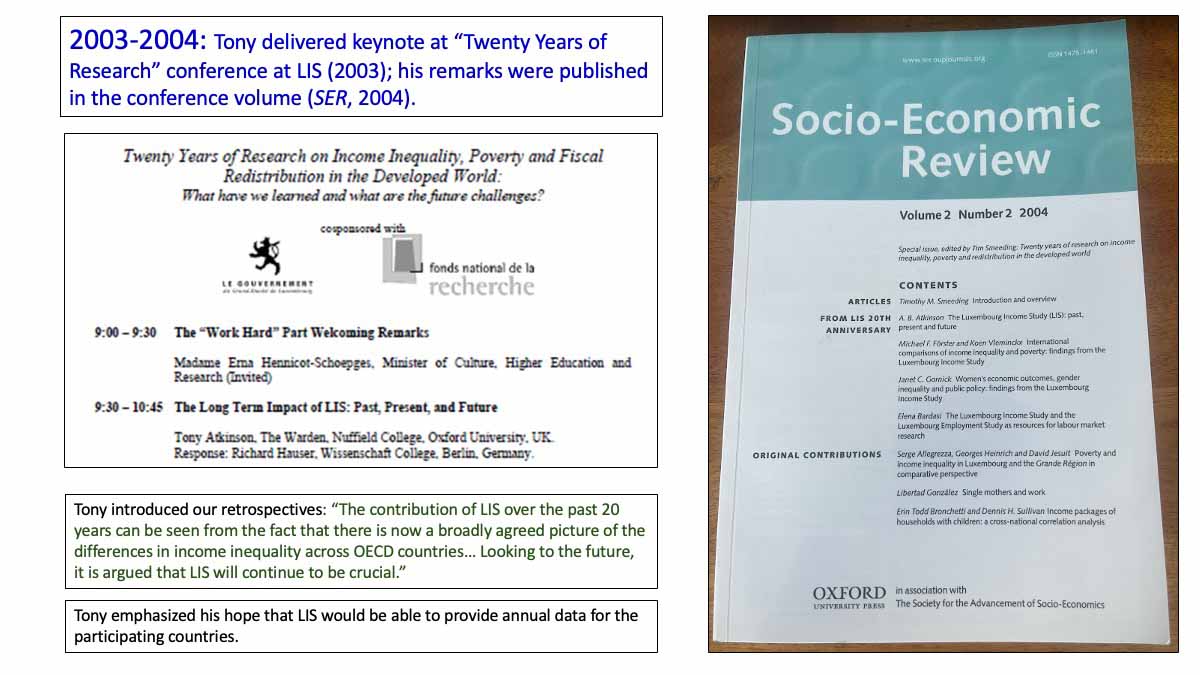
In 2003, we held an event marking LIS’ 20th anniversary; it was both a celebration and a conference. A lot of you were there. Tony gave a keynote, and his keynote and several articles were printed in this early volume, volume 2 in fact, of the Socio-Economic Review.
There were three substantive articles. One was by Michael Förster and Koen Vleminckx; that one summarized 20 years of research on poverty and inequality.
Another was by me. By then, at the end of the second decade, there were extensive person-level data and a lot of LIS research focused on gender disparities in the labor market. There were 60 papers then and I reviewed those.
And then there was a third paper by Elena Bardasi on using LIS for labor market research, something that I’ll come back to.
Again, Tony wrote the introduction, in which he praised LIS. His piece was also remarkably prescient. He talked about his concern that the future would bring weakening support for household survey data and for data infrastructures per se.
One thing that Tony said at that conference, which very much stayed with us, was that he hoped that LIS would annualize its microdata holdings. In those days, the early days, as I’m sure many of you know, we put data up in repeated cross sections which were bundled into waves spaced at five-year intervals — 1980, 1985, 1990, and so on. Eventually, when Markus and I came in, we reduced those intervals to four years and then to three years. But there were still gaps, of course, and Tony urged us to try to fill in all the gaps. We were not able to do it at the time. We lacked the resources and, in fact, many of the underlying surveys weren’t fielded annually at the time.
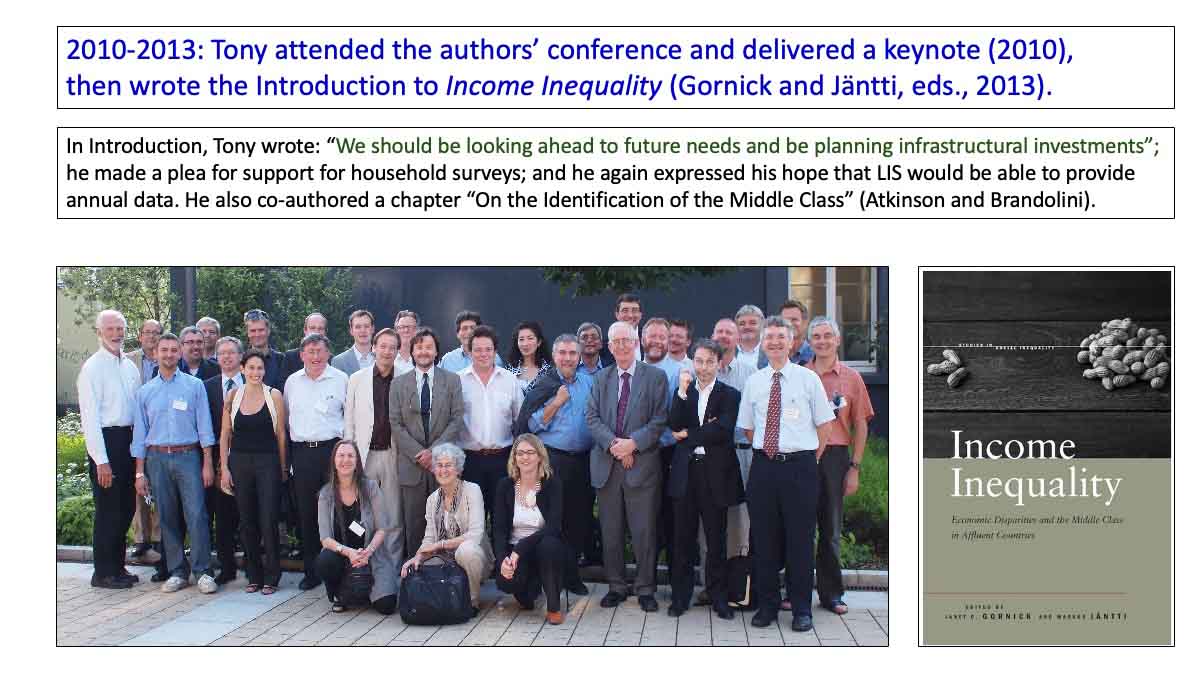
In 2013, Markus Jäntti and I edited this book, Income Inequality: Economic Disparities and the Middle Class in Affluent Countries. It was the first edited book from LIS focused squarely on income inequality. We commissioned 17 papers on various topics, all based on data in LIS (or that were soon to be added to LIS); by then we had started to add wealth data.
Three years before the final publication date, that would be in 2010, we hosted an author conference — captured in this photo — and we organized some linked events. Tony came and, once again, gave a keynote. He also contributed a chapter, with Andrea Brandolini. Tony helped Markus and I think through the framework of the book and its core threads, especially about identifying the middle class, which was then and is still now not adequately conceptualized or tackled empirically.
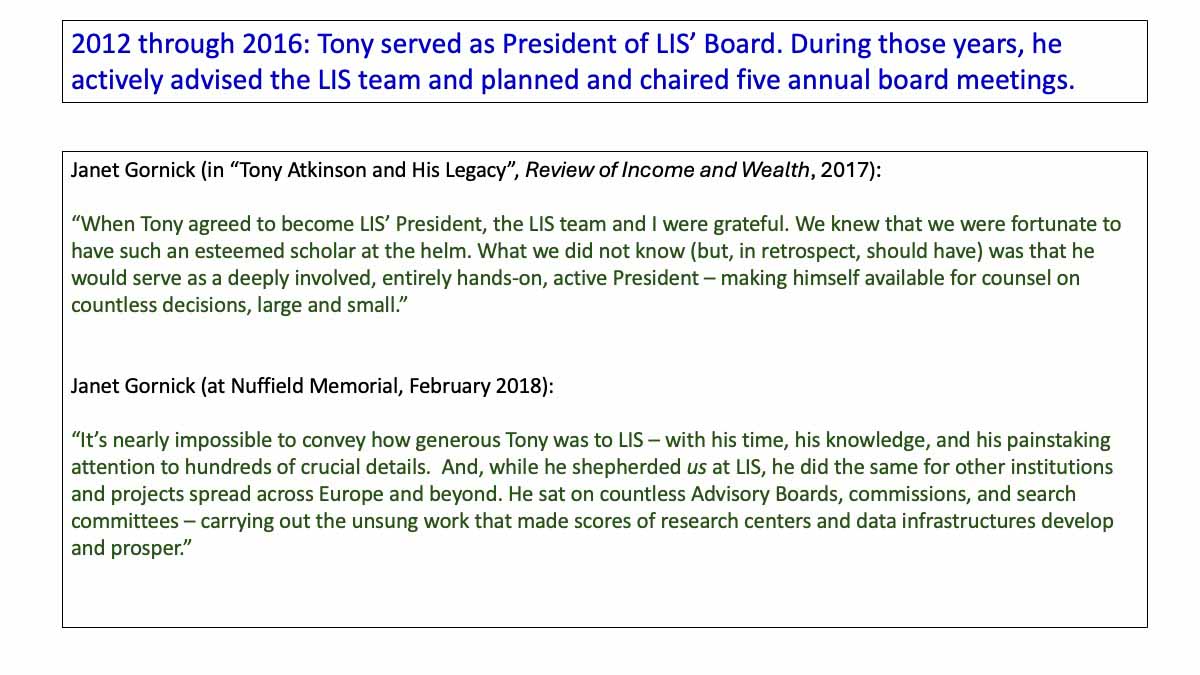
Moving forward in time, the final chapter in Tony’s long relationship to LIS began in 2012, when he agreed to serve as our board president, a position he held for five years. And during those years, he actively advised us and he planned and chaired five annual board meetings where key decisions are made about LIS’ goals and activities.
I wrote this in one of the collected remembrances, from after Tony’s death. I’m just going to read it:
“When Tony agreed to become LIS’ President, the LIS team and I were grateful. We knew that we were fortunate to have such an esteemed scholar at the helm. What we did not know (but, in retrospect, should have) was that he would serve as a deeply involved, entirely hands-on, active President — making himself available for counsel on countless decisions, large and small.” I cannot exaggerate the minutiae that he was willing to help us with.
And at the memorial service here at Nuffield, a year after Tony died, I said this and, again, I’m just going to read it:
“It’s nearly impossible to convey how generous Tony was to LIS — with his time, his knowledge, and his painstaking attention to hundreds of crucial details. And, while he shepherded us at LIS, he did the same for other institutions and projects spread across Europe and beyond. He sat on countless Advisory Boards, commissions, and search committees — carrying out the unsung work that made scores of research centers and data infrastructures develop and prosper.”
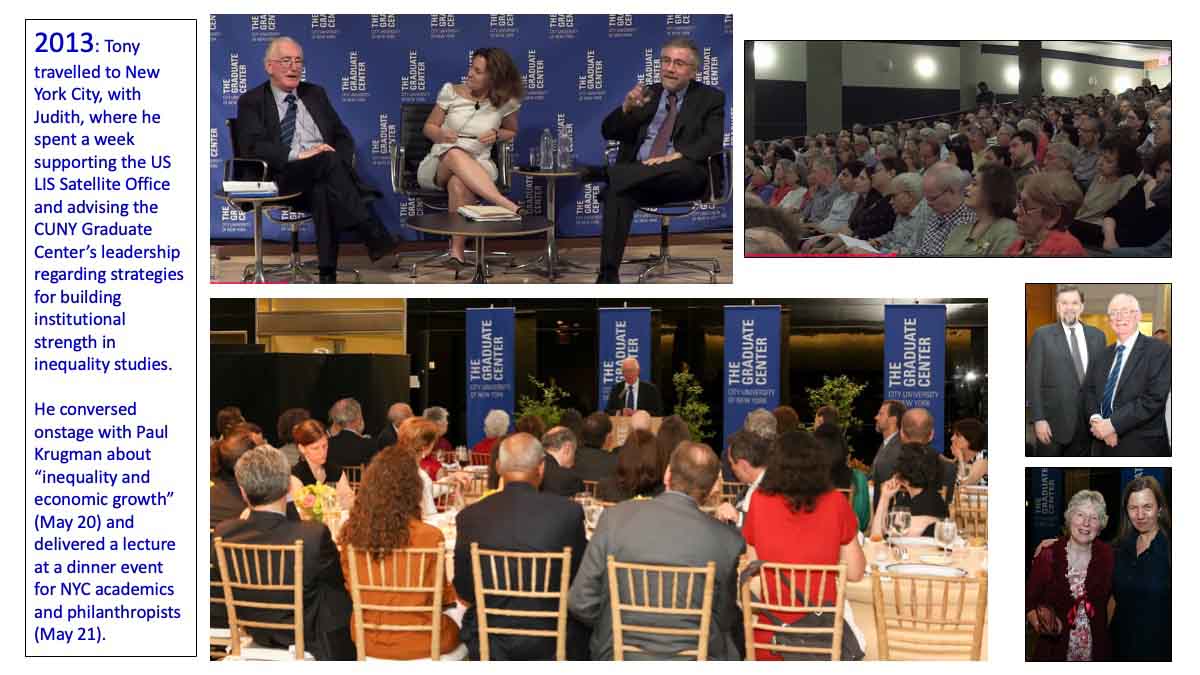
Now I want to tell you — and this is a bit self-indulgent — that, as Tony was helping people and projects all over Europe, he did not have to do what he did next. In 2013, he came to New York City for a week, with Judith. He spent a week at my university, the City University of New York, visiting and advising us. Back then, I was basically alone at the CUNY Graduate Center (the campus where I’m based) doing quantitative work on inequality. After about 2010, as you all know, interest in inequality exploded. The Graduate Center leadership wanted me to put together some programming — a research center, a database, a master’s program, something — and I was trying to figure out how to build a scholarly inequality initiative. I spoke to Tony and he agreed to come to New York for that week. He spent time talking with me, met with the Graduate Center president, and the provost, and talked to everyone connected to us.
And, as if he didn’t have more things to do, he headlined two public events for us, which brought so much attention — not just for LIS, but our nascent group at CUNY. On May 20 of that year, he sat on a stage with Paul Krugman, discussing the relationship between inequality and economic growth, in front of a rapt audience of 400 people. That conversation was moderated by Christia Freeland, then a journalist, now here at Oxford. The following evening, he delivered a lecture to 100 enthusiastic New York City academics and philanthropists.
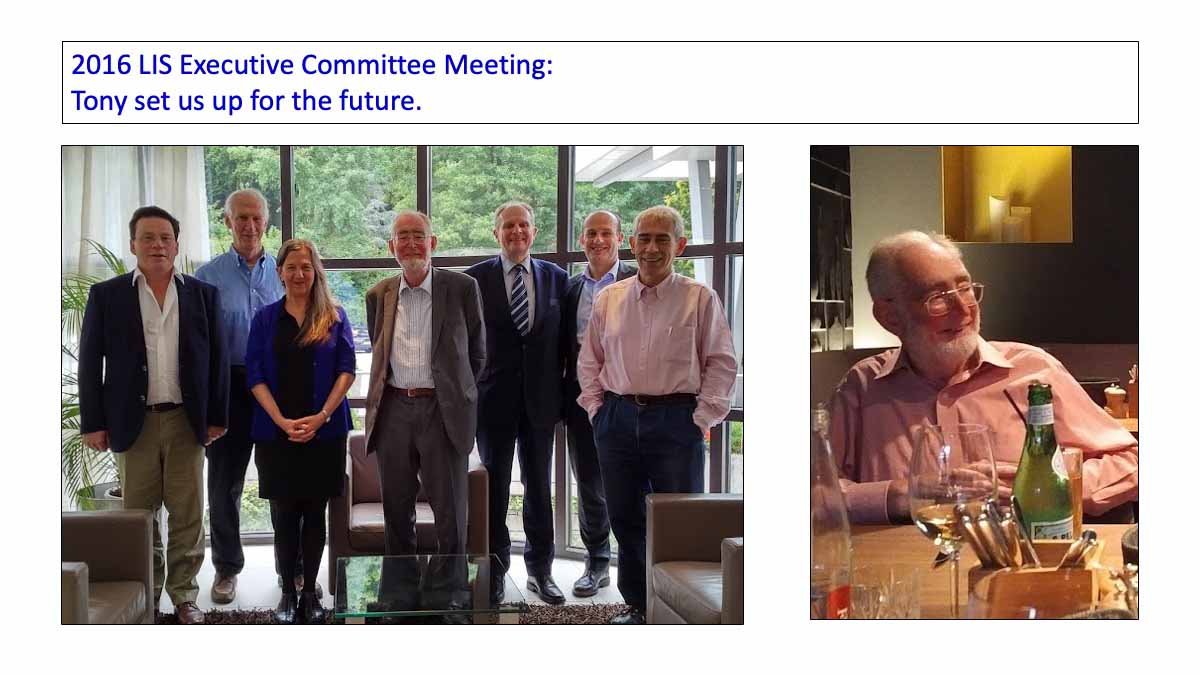
In the summer of 2016, at our board meeting in Luxembourg, Tony told us that it was time for him to step down, a decision that we resisted, but, of course, we understood that it was his to make. He asked us if we wanted him to help us come up with his successor. We said yes.
He reached out to François Bourguignon, his longtime friend and colleague, and asked François if he would succeed him as president of LIS. Tony reported to us that François replied, “I’m getting up there in the years and I’m starting to think about retirement. But anything you want, of course, I’ll do it. I’ll do it for about two years.”
Ten years later, François continues in that role — a testament, surely, to his long friendship with Tony.
So far, of course, I’ve lingered mostly on the early years. I’m going to tell you the story of the next 24 years, bringing us up to today — in extremely truncated form. Now, it’s time to look at what we have in place today.
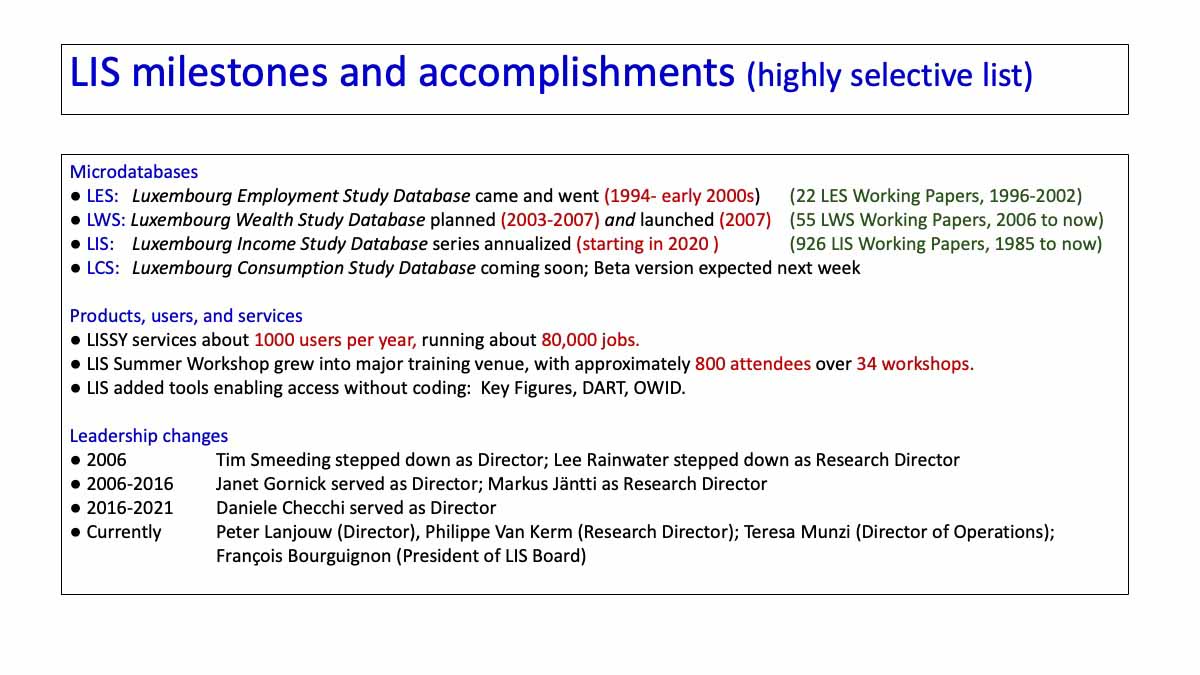
So here are some of the milestones.
For LIS’ first ten years, the only database was the original one, focused on income: the Luxembourg Income Study Database.
In the early 1990s, we decided to build a companion database, using the same idea and framework but this one would contain datasets based on labor force surveys. That was called the Luxembourg Employment Study Database, or “LES.” LES was staffed by Michael Förster, who’s here today, along with Elena Bardasi.
Michael came to Luxembourg and worked on LES there. He, with some colleagues, harmonized labor force survey datasets, mostly coming from Eurostat. The story of LES is somewhat complicated, and I’m going to give you a short version of it. LES left us with some important lessons because, in short, the project did not succeed. In the end, we concluded that it was not all that well conceptualized. We had assumed that the LES data would be utilized by researchers experienced with the LIS data, because many of them were interested in employment, and the employment data in LIS were rather scattershot. That was largely because most of the underlying surveys were income surveys, not designed to capture labor market outcomes. So, the labor force surveys would enable granular research on earnings, a key part of household income, and other employment outcomes. Then, as it turned out, most of the labor force surveys had very little data and/or low-quality data, on household income. And LIS’ community of researchers did not find it appealing to work with labor market data that contained so little usable data on household income.
The labor force data had detailed data on all kinds of employment features: job search, second jobholding, and so forth. But the LES data simply weren’t being used. We’ve written an account as to why that happened; interestingly, we learned that little published academic research is based on labor force survey data. We also realized that, in the end, LES offered little that users couldn’t get from Eurostat. So we folded it, with some regret. Still, 22 LES Working Papers remain posted on the LIS website. We decided instead to devote even more energy to harvesting and adding every possible speck of labor force information from the surveys underlying LIS — and that’s what we did.
Despite the lessons from LES that made us nervous, this process was largely repeated in 2003, with the beginning of the Luxembourg Wealth Study Database (LWS), LIS’ third micro-database. LWS was largely the brainchild of Andrea Brandolini, and he oversaw the development of its pilot. Again, the plan was the same: bring in wealth microdata, harmonize it ex post, document it, and make it available for research. We launched LWS in 2007. This time, unlike with LES, the database thrived. I am happy to say that the LWS Database is getting a lot of use – and it’s growing.
And next week, a fourth database will be launched — containing consumption data. I’ll come back to that.
So, where are we now?
We now have about a thousand users per year, running approximately 80,000 jobs annually. The LIS Summer Workshop lives on. We’ve held 34 workshops, graduating more than 850 attendees, several of whom are in this room.
We have also added tools for the purpose of opening the microdata, as well as indicators based on the data, to people who do not write code for whatever reason. We provide what we call Key Figures, which are well known and widely used. Every time a microdata set is posted, an automated process is used to develop a series of aggregate indicators, and those are online for anybody’s use. We also built an online table maker called DART (which we hope to revise), and recently we started a collaboration with Our World in Data. Now you can go to either website, Our World in Data’s or ours, and create some beautiful data visualizations. For now, though, those cover only levels and trends of poverty and inequality, but I suspect that will be enlarged over time.
Finally, the leadership changed. Tim and Lee stepped down in 2006. Markus and I came in. We stayed for 10 years, working together closely. We were followed by Daniele Checchi, who served as director briefly. Currently LIS is directed by Peter Lanjouw along with Philippe Van Kerm — who is here — serving as research director. (That is somewhat of a misnomer; the position is basically a second director.) Teresa Munzi, who has been at LIS for many years, serves as director of operations; on a day-to-day basis, she basically runs LIS and she has for a long time. And François remains the board President.
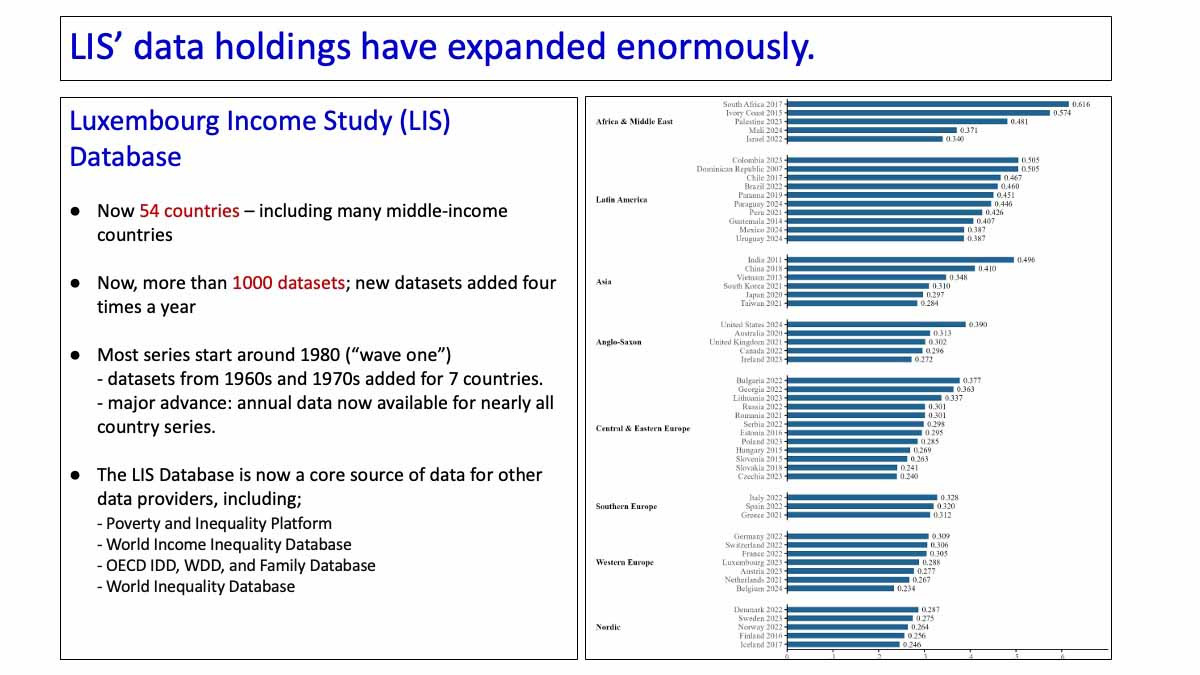
The LIS data holdings have grown enormously — over the years, from seven countries to 54 countries, and now include many middle-income countries.
This chart reports Ginis of disposable household income, organized by geographic region. We now have more than 1,000 datasets, a dramatic increase from seven when we started. New datasets are now added four times a year. Most of the LIS series go back to 1980, Wave I, but, for a few, we’ve managed to bring in data from the 1960s and ’70s. And — this is a crucial development — now nearly all of the data series have been annualized. In 2020, we started to annualize the data and we have largely completed that process. We’re proud of this development and gratified that we were able to fulfill Tony’s wish.
Finally, now, LIS’ microdata feed several other data projects, projects usually referred to as providers of secondary, or aggregated, data. Our microdata feed widely used data sources, including the Poverty and Inequality Platform, which is the successor to PovcalNet, as well as the World Income Inequality Database, based in Helsinki. Also, the OECD Income and Wealth Distribution databases, and their Family Database, use a lot of LIS data. The World Inequality Database, which I’ll come back to, also uses the LIS microdata extensively. They use it to carry out the DINA method; the LIS data enable the distributional work needed to create the synthetic distributions at the heart of their work. We are, of course, proud to help populate these other data sources.
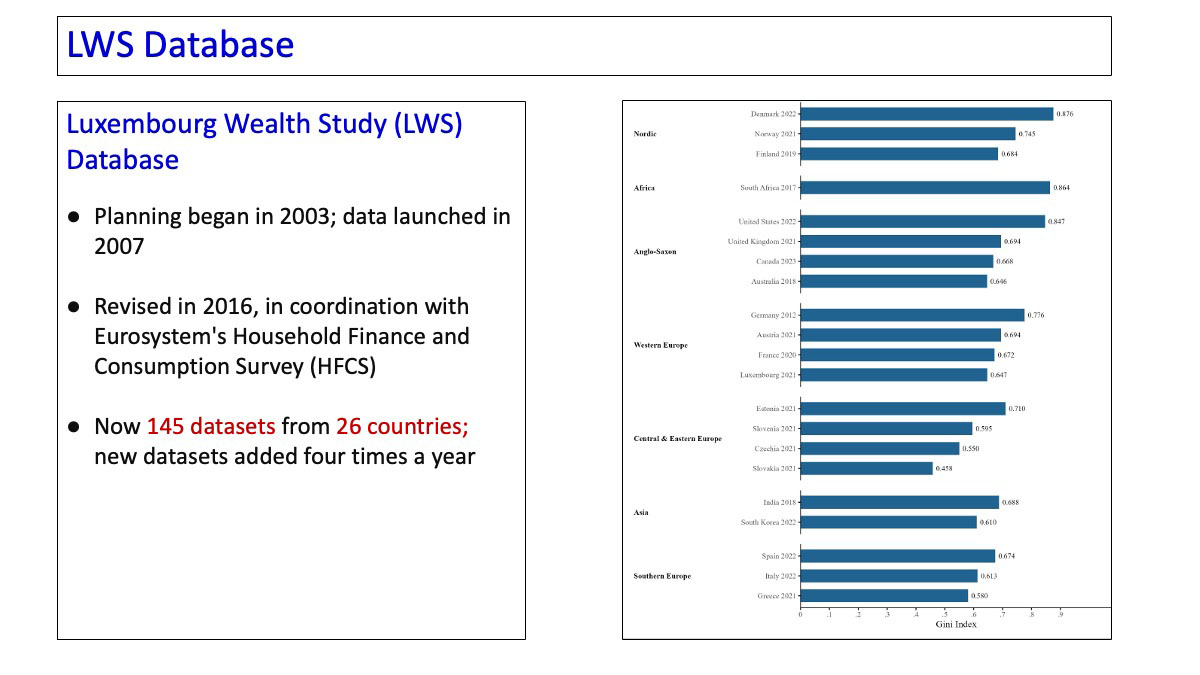
The LWS Database has thrived.
It started as an experiment and now has 145 data sets from 26 countries, and continues to grow.
We paused for a period of time and worked closely with the project linked to the European Central Bank: the Household Finance and Consumption Survey. That was, as many of you know, the first source of wealth microdata that was harmonized ex ante – meaning at the survey stage. The team at LIS that was working on the LWS Database worked closely with the designers of the HFCS. We attended several meetings in Frankfurt in order to collaborate with members of their network. What we had learned from harmonizing wealth microdata helped to inform the design of their questionnaire and what they were learning helped us. Nearly ten years after we launched LWS, we revised our template so that it would be consistent with elements of the HFCS; that set us up to receive and add several of the HFCS datasets.
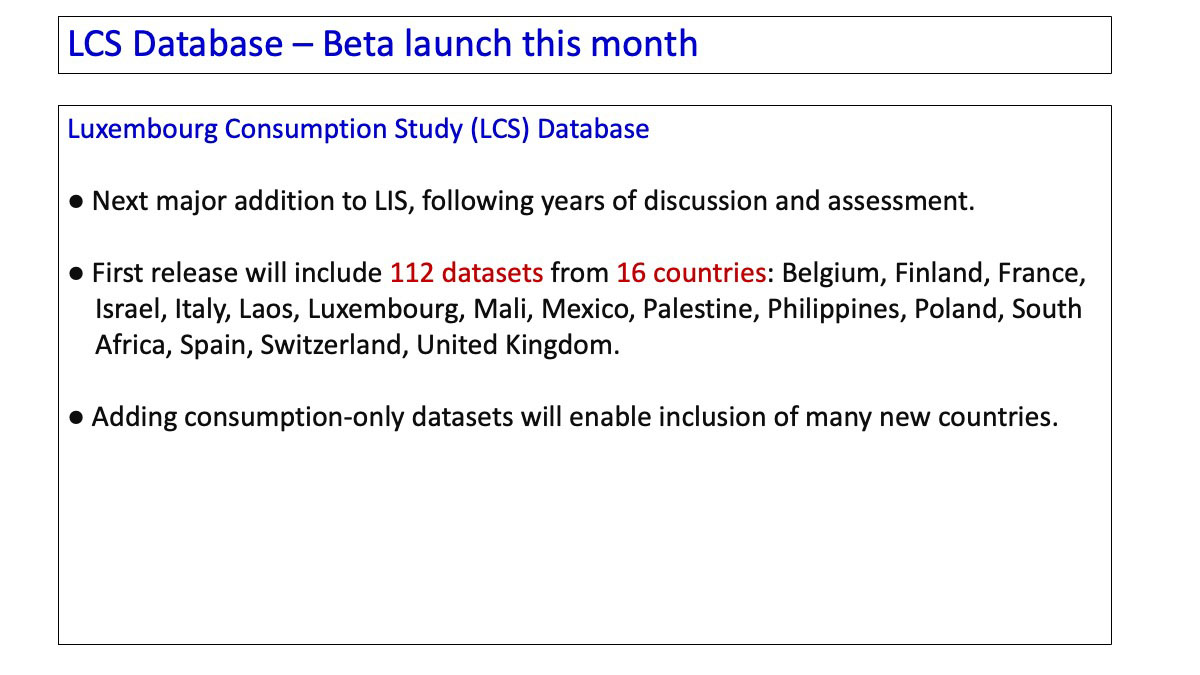
Next week, we will launch the Luxembourg Consumption Study and we are, yet again, holding our collective breath. We’ve been working on this for a few years. The first release will include 112 data sets from 16 countries.
Let me clarify that both the LIS Database and the LWS Database do contain blocks of consumption variables. They are not very extensive or detailed, because most of the surveys underlying LIS and LWS were not designed to be consumption surveys. As many of you know, a large number of countries do not collect, or do not rely on, income data. They gather consumption data, largely because in many countries, especially lower income countries, income is not an ideal metric to capture wellbeing.
As a result, there are many countries we’ve never included because, until now, we wouldn’t take consumption-only datasets. Now, after talking about this for a mere, oh, I don’t know, 25 years, we decided that it was time to launch this. We hope that what that means, and this is ambitious, is that LIS will finally become a truly global data source. We shall see.
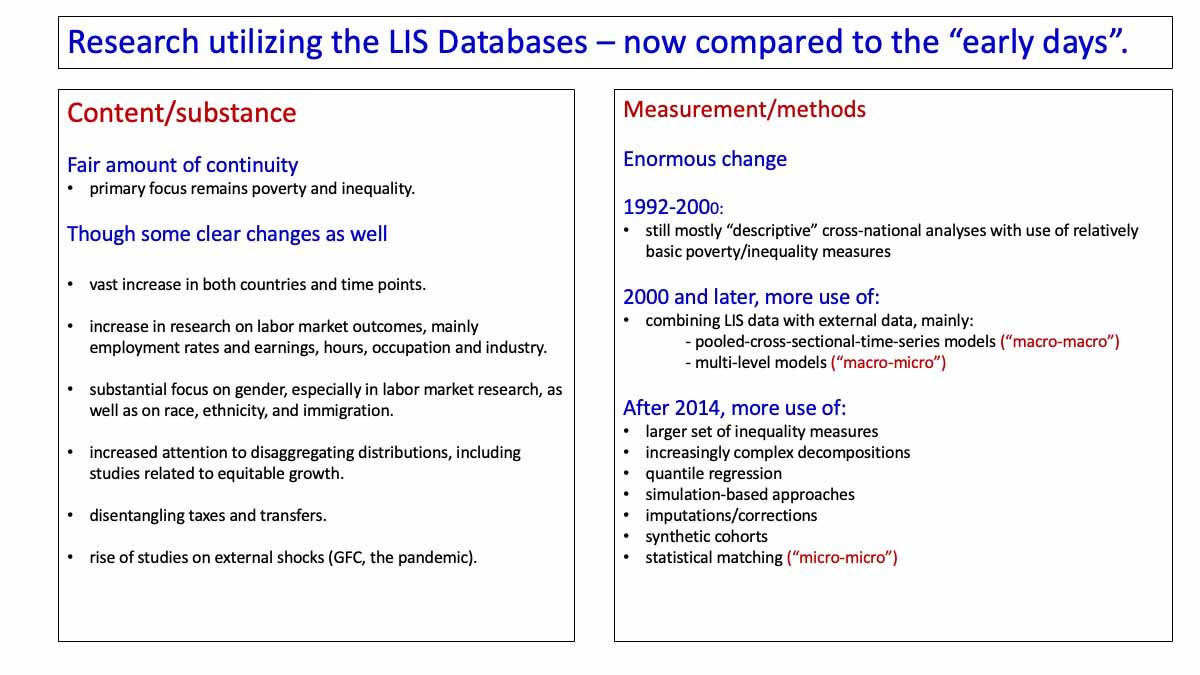
By now, an immense amount of research has been based on the LIS databases. There are now a thousand Working Papers, many of which have been published, as well as a large collection of dissertations, books, monographs, and so forth. What does this look like? What is the content of the research in recent years, compared to, say, the 1980s?
This is my own not-terribly-scientific summary. Still, this is what I see.
First, the primary focus of work based on the LIS data is still overwhelmingly poverty and inequality. At the same time, much has changed, which makes the 1980s nearly unrecognizable. Very important has been the vast increase in participating countries, which has opened up research on a far larger set of countries, and on countries that are more diverse in both geography and economic development. Equally important has been the introduction of over-time data, which opened the possibility to study trends, and as many of you know, trends are often more robust across data sources than are levels.
Second, there’s been a huge increase in research on labor market outcomes, mainly on employment rates, earnings, hours, occupation, and industry. As I noted, when we retired the LES Database, we decided to go back into the original datasets that populated the LIS Database and to extract and harmonize every bit of the labor market information. I spent a great deal of time working with the staff on that extension. Now many researchers use the LIS Database to study labor market outcomes.
Third, there is now a substantial focus on gender, especially within the labor market research, as well as a lot of work on race, ethnicity, and immigration. We worked hard to standardize the immigration data, which is a major challenge, given the variation in the underlying surveys.
In addition, now we see a lot of attention paid to disaggregating distributions, including work on what we would call inclusive growth or equitable growth — that is, looking at what’s happening at various parts of the distribution.
Today, there is also a body of work that disentangles taxes and transfers. That can be tricky because the border between taxes and transfers is often porous and ambiguous. Still, there are several interesting papers which have taken those apart, mainly to ask which of the two is doing the heavy lift on redistribution. And, to the extent possible, some excellent papers disaggregate income taxes from social contributions and/or, on the transfer side, social insurance from social assistance.
Finally, of course, the availability of annual data, and the long timeframe, opened up the possibility to look at the “effects” of external shocks — and I know that it’s illegal to use the word “effects” like that — on inequality. LIS researchers have considered the aftermath of both the Global Financial Crisis and the pandemic.
And what about the measurement side?
I still love that Science article from 1988 because it was so simple and elegant. But today, of course, everything is much more sophisticated, much more complicated. Up until about 2000, most of work remained what we would call descriptive.
After 2000, new methods appeared. Most interesting, in my view, has been the practice of combining the LIS microdata with external data sources. LIS data users began to combine or merge the LIS microdata with data from external data sources — with data of all sorts, on, e.g., voting behavior, ideology, health outcomes, policy features, macroeconomic factors. These lines of analysis have been enabled by the large and growing number of datasets.
There are three main ways to do that.
Many LIS papers present what are called pooled cross-sectional time series models. This might be called a “macro-macro” approach, in which the LIS data are combined with variables from external data covering, for example, political behavior, ideology, unionization, social spending, health outcomes, longevity, and more. “Macro-macro” is my label, but the point is straightforward: variables are coded at the macro level and the unit of analysis is the country-year. The LIS microdata are grossed up to country-year aggregates and combined in a model with country-year measures on other variables. The LIS variables may be the explanatory or the dependent variable. Users create a new dataset, with, say, 12 countries and 10 time points, and estimate a model with an N of 120. That is a framework that has been commonly used in the LIS literature.
A second approach, also commonly used, especially among sociologists, are multi-level models — we could call these “macro-micro” — where the microdata are nested in country-level data coming from outside LIS. These multi-level models, as many of you likely know, allow one to look at the “impact” of country-level variables on both micro-level outcomes and micro-level slopes. They are often used to assess whether policy measures operating at the country level have the effect of flattening inequalities at the micro level. There are many papers taking that approach.
I informally surveyed all of the papers released after 2014. In these recent years, LIS papers often utilize a growing variety of inequality measures, more complex decompositions, quantile regressions, simulation-based approaches, imputations, corrections (especially of the top) and more. The use of synthetic cohorts has grown, partly thanks to Louis Chauvel; in those, you look over time at increasingly older age groups.
Finally, there is a small literature, with just a few papers even now, about three, that use statistical matching (a “micro-micro” approach). That refers to taking two microdatasets, identifying or creating a common roster of variables, and merging the datasets based on those common variables. This can be done extremely simply, or it can be done using more complex probabilistic approaches.
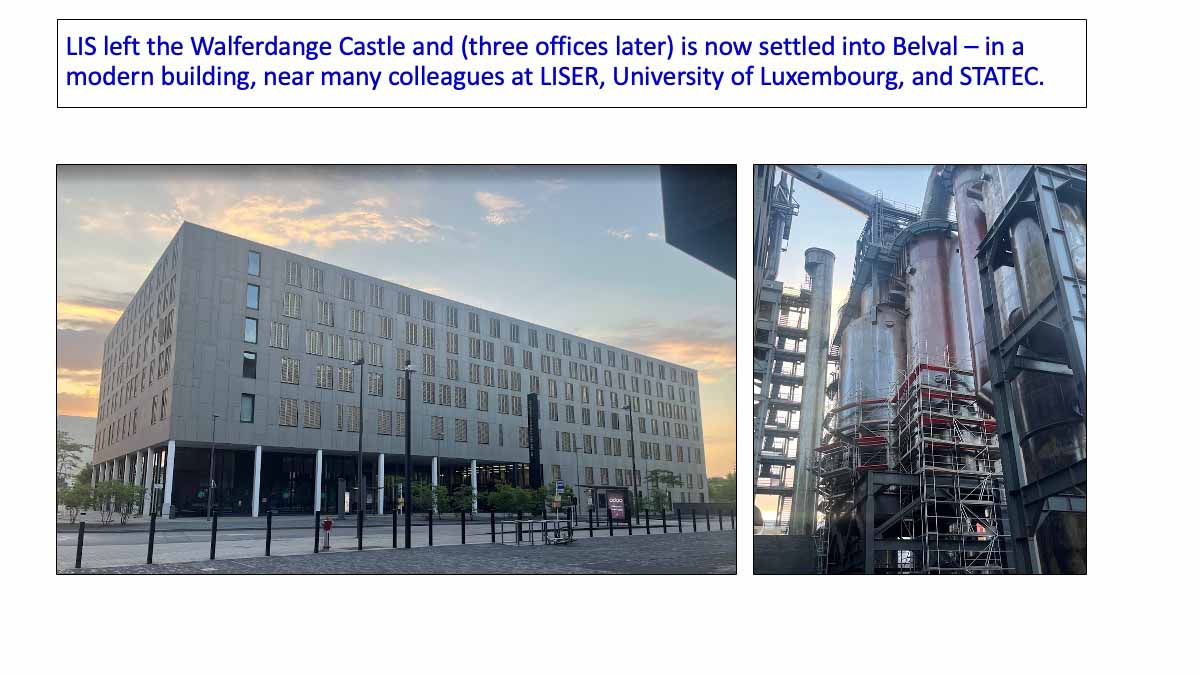
LIS left the Walferdange Castle and, three offices later, we’re now settled in Belval, in a modern building. Belval is about 35 kilometers from Luxembourg City. It’s a planned city and an unusual looking place. It was built around a former steel mill, a deep part of the history of Luxembourg. Like, say, the Centre Pompidou in Paris, part of the concept is that the interiors of the old industrial structures are visible. So, you walk around Belval, surrounded by immense dramatic-looking abandoned furnaces.
Intellectually, the setting is vastly different from those of early lonely years. We are now sitting, literally, across the hall and upstairs from many colleagues who are doing similar and related work. We share a floor with valued colleagues at LISER, the reincarnation of the old CEPS. A division of the University of Luxembourg, which opened in the 1990s and early 2000s, is located one floor below. And STATEC, the national statistical office, moved to Belval, as well, and they are a short walk away.
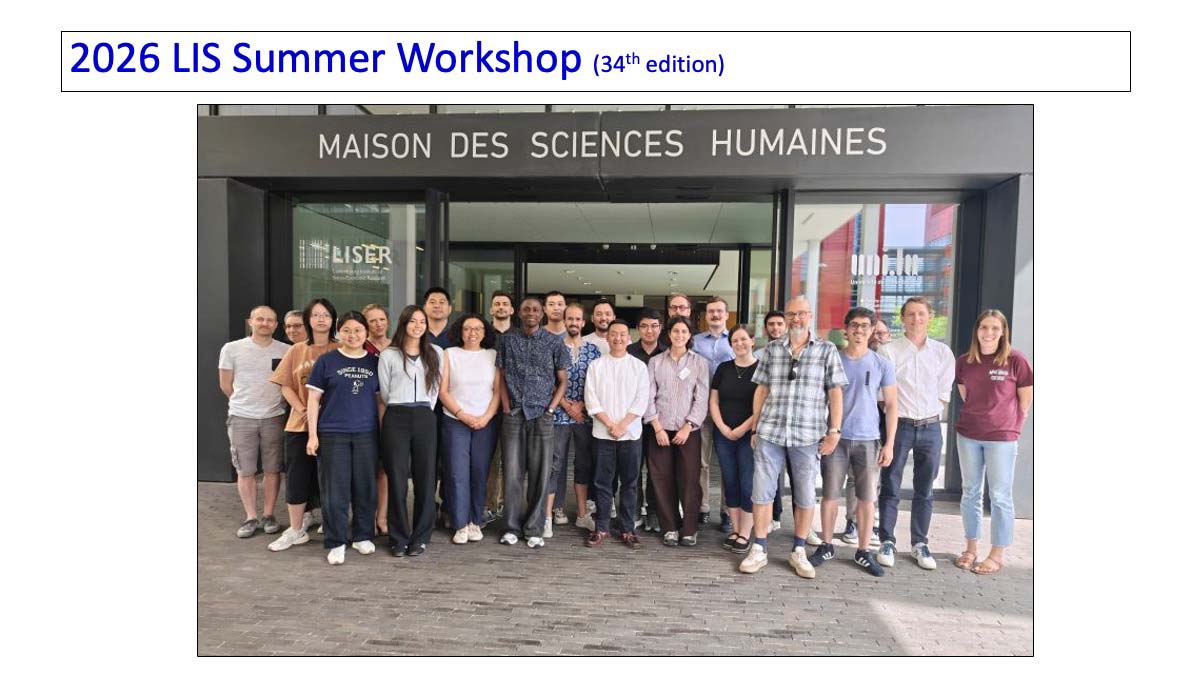
This is a photograph of the 2026 LIS Summer Workshop, the 34th edition; the students are in front of our building in Belval. We’ve held only 34 over the years because we missed a few, due to COVID and a couple of years when we were moving offices.
We are gratified that young people still come, even though getting on an airplane and flying somewhere to learn about data is surely yesterday’s technology; still, the workshops have been full every year. We continue to attract smart young scholars who come to Luxembourg each year to learn. It’s important to note that, now, they arrive with a vastly higher level of skills than the ones who came back in the 1980s. So, we’ve had to revamp the pedagogy completely. The LIS team is brilliant and experienced at instruction, and they have continually updated the curriculum.
I have one last chapter of my story. I want to close by underscoring a point that I think you all have gotten by now, and that is that the world has changed. And the changes have given rise to new challenges.
Read More: