October 21, 2026
This is Part III of Stone Center Director Janet Gornick‘s keynote address, delivered at this year’s Atkinson Conference on Economic and Social Inequality. The conference, which took place at Nuffield College, Oxford, in September, was named in honor of Sir Anthony (Tony) Atkinson (1944–2017), one of the most influential scholars of inequality. Atkinson served as the board president of LIS, the cross‐national data archive and research center located in Luxembourg, from 2012 to 2017.
Gornick served as the director of LIS — formerly known as the Luxembourg Income Study — from 2006 to 2016. The following transcript, based on a recording of her lecture, has been lightly edited for clarity.

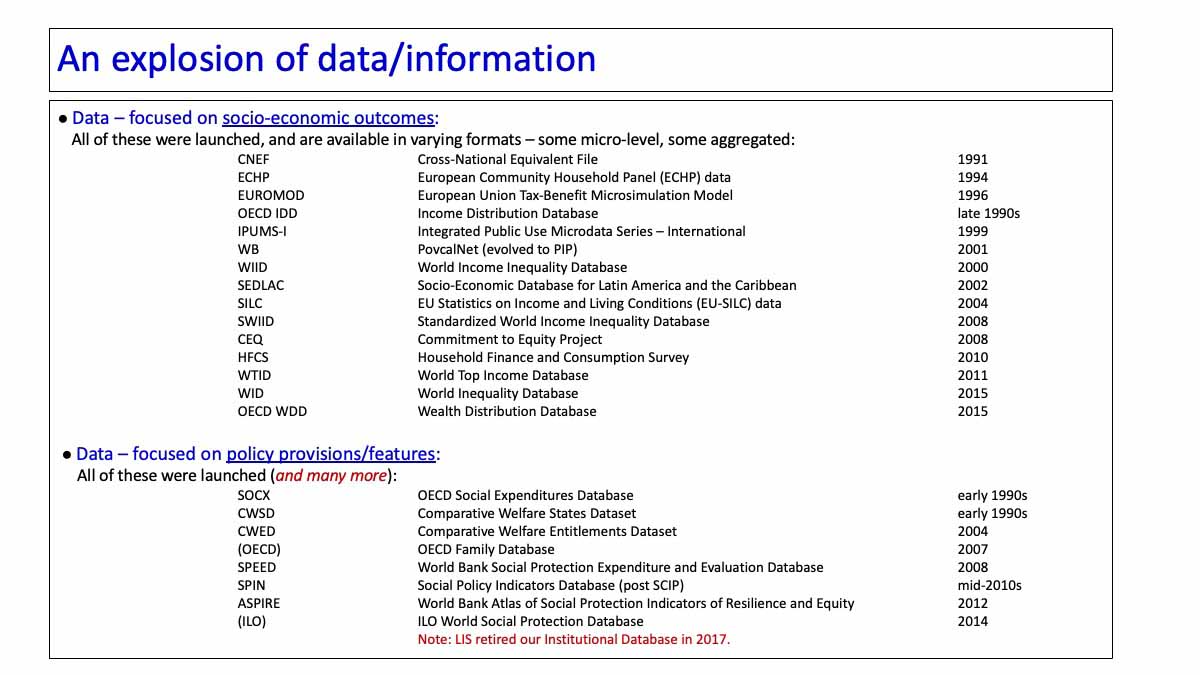
Outside of LIS, many other things changed. As LIS grew, all those datasets and databases that I noted earlier weren’t in existence; now they all are. They were introduced in the 1990s and throughout these years. EUROMOD, of course, has been important for microsimulation. The CNEF is somewhat parallel to LIS but provides panel data. CEDLAC was launched, as well as the ECHP, the SILC, the HFCS, the WID, the other WIID, the SWID, the WTID, the OECD. Now we have all of these.
This is important: these vary enormously. In a few minutes, I’m going to discuss one particular review of these other related databases; those authors note that these data sources are often dichotomized into primary and secondary data, but that’s too simple. These data sources, more accurately, fall on a continuum; some are hybrids. Some of these projects collect and harmonize microdata and make them available to users in the form of microdata; that includes LIS, the SILC, and the HFCS. With others, there are microdata in the back end; but the front end contains aggregated data, often accessible via an online table maker. One example, in fact, is PovcalNet (now called PIP) at the World Bank. LIS sends the PIP team income values in bins, based on our microdata, because we can’t share the actual microdata. In any case, these data sources are a complex mix of microdata and aggregated data.
Some of these data sources substantially changed the research landscape. The Household Finance and Consumption Survey has enabled research on micro-level outcomes related to wealth. The World Top Income Database directed attention to the fact that survey data don’t adequately cover the top of the income distribution; to account for that, they turned to tax data. The WID, its successor, would change course again. I’ll come back to this point.
Social policy data have also exploded. Recall my tale of when I arrived in Luxembourg and asked Tim, “Where am I going to get social policy data?” — and we realized that I had few options. Now there is an incredible overload of policy data, much of which I’ve worked with, some of which I’ve helped to compile. Frankly, a lot of it is messy, not well harmonized, and not easy to work with — but there’s plenty of it. Largely because of this incredible amount of available social policy data, after 20 years, we retired our institutional database, the one that I launched in the early 1990s. Our data users at LIS wanted a broader and growing array of institutional data, and it was too labor-intensive to continue. We concluded that it served its purpose and let it go. (In some ways, I miss it.) Now we tell scholars, essentially, “If you need institutional data for your pooled time series estimations, or your multilevel models, or whatever, just go get what you need.”

The explosion of data and information is both cause and consequence of the production of a vast amount of new empirical research, especially in the wake of the global financial crisis, and related economic and political events.
We’ve seen the publication, since 2010, of approximately 3,500 books and monographs focused squarely on facets of economic inequality.
University-based degree programs, certificates, and predoctoral and postdoctoral positions focused on inequality studies have proliferated.
We’ve seen the launch of new or expanded centers and institutes, in many countries, focused on the study of economic inequalities. That includes, now, 14 Stone Centers, funded by the philanthropists who support our center at CUNY; those are spread across the U.S., Canada, UK, France, Germany, and most recently Hong Kong.
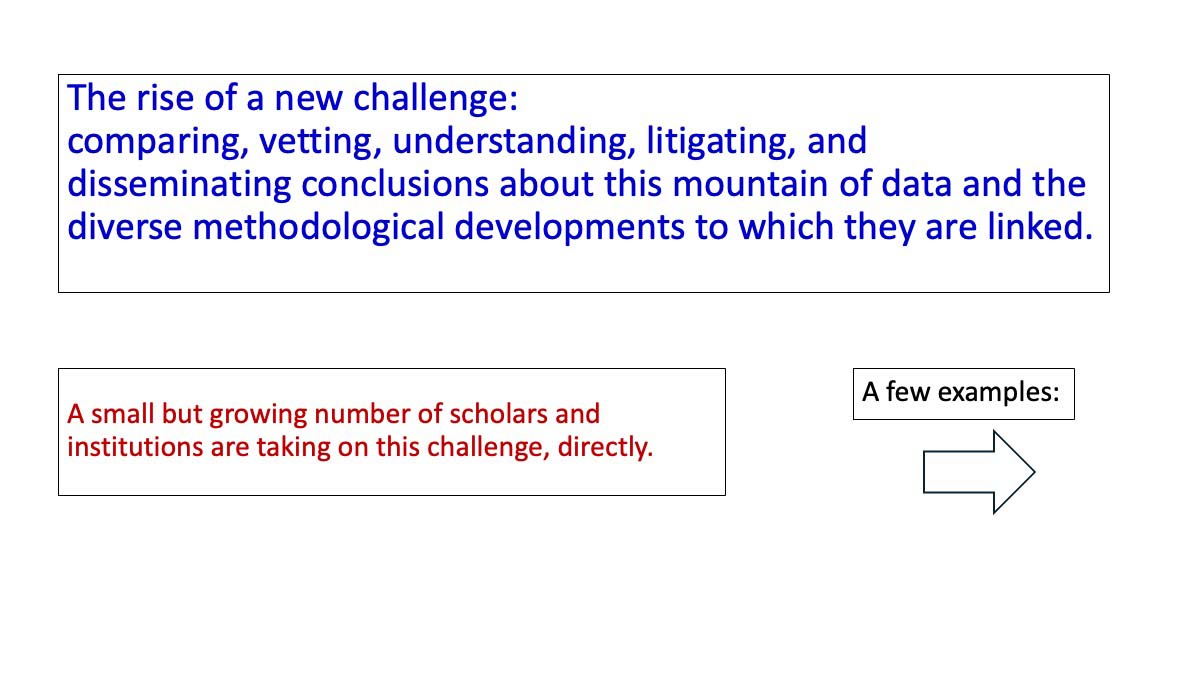
This brings me to my closing point, and that is that all of this growth has given rise to a new challenge. Now we face the challenge of comparing, vetting, understanding, litigating, and disseminating conclusions about this mountain of data and the diverse methodological developments to which they are linked.
In fact, now there is a new literature developing, one whose purpose is to assess how all of these data sources compare, that is, to understand and explain how these various data sources do and do not differ. I am going to show you six examples. Several people here today took part in these comparative exercises.
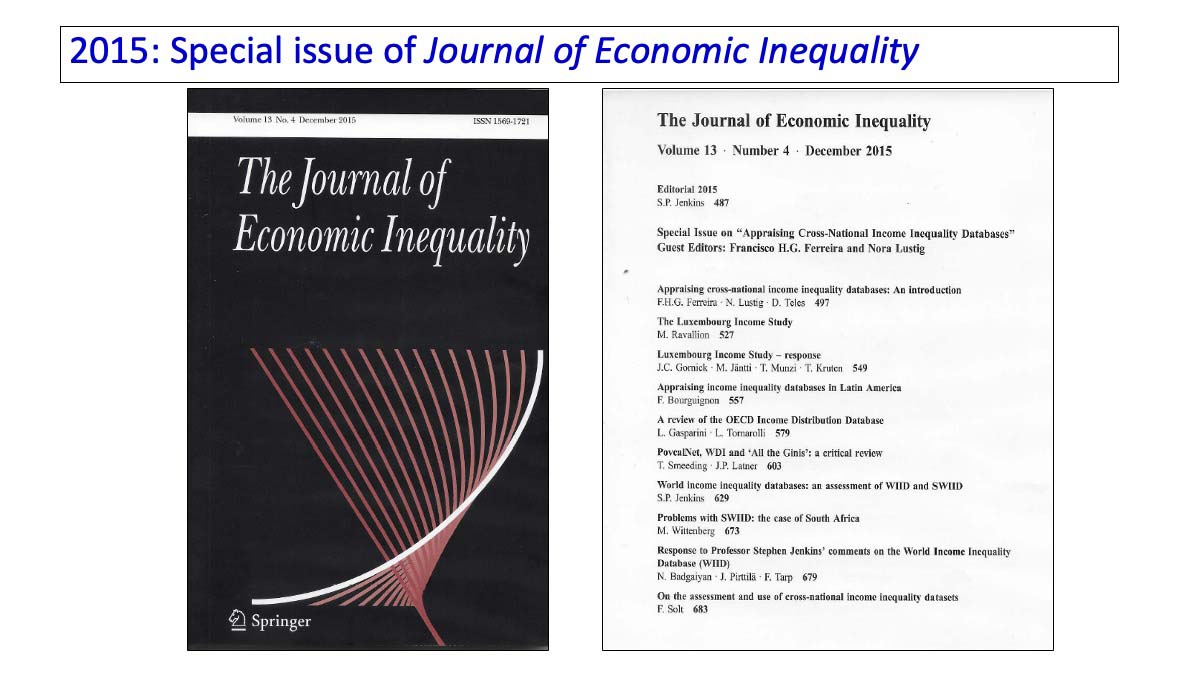
In 2015, a special issue of The Journal of Economic Inequality was published. Stephen Jenkins was the journal editor, and the issue was edited by Chico Ferreira and Nora Lustig. It was titled “Appraising Cross-National Income Inequality Databases.”
I reread the introduction, which is very rich, this past week. They selected eight databases to review, for the most part, each separately. Well-known inequality scholars were asked to review them based on standard set of questions: What exactly does the database include? What is achieved? What’s strong? What’s weak? In some cases, reviewers assessed more than one, grouped together.
The introduction, by the issue editors, presented an overview. In that, they made the point that I just made: there is no simple typology that captures the variety of structures. Dividing these into microdata and secondary data is a start, but it’s too simple.
You can see the eight in this slide. They include LIS, some focused on Latin America, the OECD Income Distribution Database, three from the World Bank, as well as the WID and the SWIID.
Let me simply say, for anyone who thinks that this was a nerdy technical project, it wasn’t; it was really heated. It was heated in part because the editors gave teams from the databases the opportunity to respond to the essays about them. (You know, these databases are like our children; you criticize them at your peril. And your criticism better be correct!)
Martin Ravallion wrote a somewhat critical piece of LIS. In fact, his criticism was not squarely focused on LIS. He was critical of the use of income data more generally; he didn’t like LIS’ use of relative poverty lines in the Key Figures, and his main criticism was that LIS didn’t cover the whole world. On that last point, he was surely correct. I often remind others, when referring to LIS, not to describe LIS as a global data source, because it isn’t — not yet. So, Martin beat us up a bit! Markus Jäntti, Teresa Munzi, and I pushed back on some of the criticism. Our exchange with him got a bit heated.
But that was nothing compared to the knockdown, bloody, battle over the SWIID. Stephen Jenkins, in his review — I can’t think of another way to say this — beat the crap out of the SWIID. Why? Because the SWIID relies on so much imputation and interpolation — not just within the datasets, but over time, across countries, intergalactically. Stephen wasn’t a fan. So that was lively.

I then went looking for other similar exercises.
This one — a 2015 OECD Working Paper — was new to me; I just found this when preparing this lecture. OECD was beginning to assemble the Wealth Distribution Database, an aggregated data source, and they wrote this technical paper comparing their own template with other databases: the ECB’s Distributional Wealth Accounts, the WID, LWS, and HFCS. They prepared what several of these exercises now construct — a matrix, essentially, with the databases compared on various dimensions. Readers can see for themselves what’s the same and what’s different.

The publication of the 2019 Human Development Report was another adventure that resulted in substantial debates and disagreements.
In preparing the 2019 HDR — focused on inequalities — the United Nations Development Programme (UNDP) outsourced the income inequality chapter to a team at the Paris School of Economics. The World Top Income Database had evolved into the World Inequality Database (WID) by then and that was the data source for the chapter. When the chapter reached UNDP, the team there was bewildered because the results — about levels of inequality and degrees of redistribution — looked rather different from results coming out of LIS, Eurostat, OECD, and so on. UNDP convened an expert group, which included me and Nora Lustig and several others, and they gathered us in Paris where we sat around a table, with the team at PSE, to assess why the results looked so unfamiliar to the UNDP editors.
The key issue is that the chapter that the WID folks produced was based on the distributional national accounts (DINA) framework, one that they are very much associated with. What is the DINA approach? As most of you know, I’m sure, the DINA approach measures inequality by distributing 100% of national income, as recorded in national accounts, across the population. Both survey data and tax data are used to construct synthetic income distributions. In addition, the DINA method imputes additional income components (not captured in survey or tax data), such as social transfers in-kind, undistributed corporate profits, and an array of public services including defense.
The resulting inequality outcomes, not surprisingly, were different from those produced by survey-based and other methods that UNDP was more familiar with. The inequality levels looked different as did levels of redistribution as captured by the “pre” versus “post” framework that I discussed earlier. The WID data are well-known and, of course, are somewhat controversial. In any case, the end result was that UNDP asked several data groups to work together to produce a matrix of sorts — you see that in the slide — one that would systematically compare income definitions and approaches to measuring fiscal redistribution across the various data projects. The table compared inequality measurement as carried out by the Commitment to Equity Project, EUROMOD, LIS, and others — thus allowing readers of the HDR, and inequality scholars more broadly, to understand the various approaches to measuring inequality, and the ways in which, and the extent to which, results vary.
In any case, the table indicates that the approach taken by the WID team in 2019 was substantially different than what most others were doing. Was it brilliant? Was it not brilliant? I leave that to you. But I think we can fairly say that it was different.
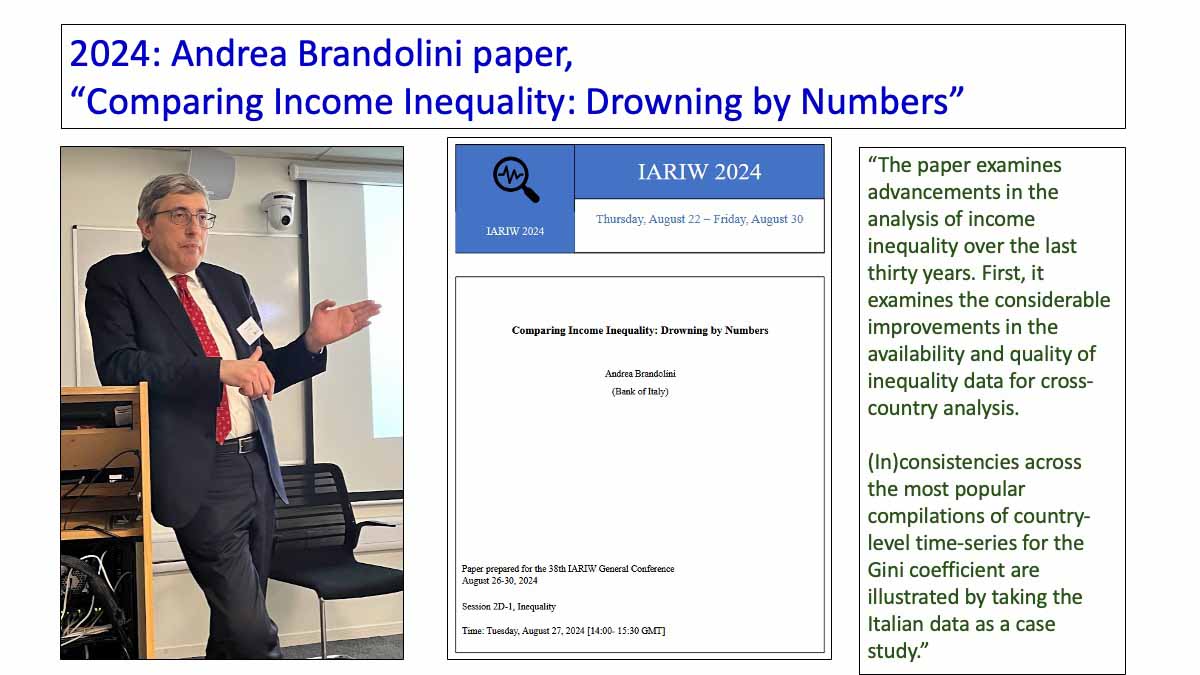
In 2024, Andrea Brandolini released this paper. I love this title! “Comparing Income Inequality: Drowning by Numbers.” That would have been the perfect title for my remarks today (except that I wouldn’t steal it). Andrea developed this argument over many years. I heard him give a version of this talk about 20 years ago, and again when he delivered a later version at the 2023 LIS/LSE conference (where I took this photo).
The essence of the talk — one that is a bit tough for we data providers to hear — is that estimates of inequality, especially of levels, vary widely because data sources are different in ways that can only be untangled with close and careful inspection. Andrea stresses that differences across projects and sources are not purely technical; they reflect different concepts, even different theories, about inequality. In an empirical section, he demonstrates his key point by comparing results based on “the usual suspects,” that is, many of the same data sources that I’ve mentioned today.
Andrea ends on a somewhat optimistic note, pointing out that, overall, data quality is much better now than in the past. There are still inconsistencies, but the positive news is that inequality scholars now understand the sources of those inconsistencies. We can diagnose what underlies inconsistent results. Still, that’s a tricky and complicated process and it requires paying attention.

Finally, there are two papers in process right now, both dated July 2026. They are both posted in our Stone Center Working Paper Series, and both are forthcoming later this year in a special issue of Oxford Open Economics. Both focus on inequality across countries — covering levels and trends — with the one on the left focused on income and the one on the right on wealth. (Several of these authors are here today).
I think that these papers signal a major step forward in terms of intertwining substantive findings with granular assessments of the underlying data. They both argue that multiple data sources are available and that they vary, largely for systematic and somewhat predictable reasons.
The income paper compares inequality results from survey data versus those based on national accounts approaches. They find that researchers using survey data generally find lower levels of inequality and more moderate increases than do those using the latter; those who use consumption data, of course, typically find even lower levels. The wealth paper takes a somewhat similar approach, reporting levels and trends — though they find a stronger patter of rising inequality — and they too take a granular look at why different data sources turn up different estimates. Both papers find more consistency across sources and methods with trends compared to levels.
Before I close, I want to point to something related to this wealth paper — something that I’m very proud of — and that is the GC Wealth Project. The GC Wealth Project, conceived of and directed by Salvatore Morelli, is based in our Stone Center at CUNY, although now the actual work is carried out mostly in Rome. The GC Wealth Project has gathered a vast amount of wealth data, documented it, and made it available via a data warehouse and a set of visualization tools. The project’s main “claim to fame” is that it makes available extensive information about the component data sources, enabling users to understand what each series contains and the methods on which it is based. A core goal is to enable users to assess apparent inconsistencies. In a few weeks, Version 2.0 — expanded, updated, and renamed the Wealth Inequality Project — will be released.
Let me close by noting that, now, not only do we have a mountain of data, we have a growing mountain of projects comparing the mountain of data. Everyone in this room clearly has the technical capacity to sort through these comparative assessments, but it still constitutes a challenge. It takes time and concentration to assess the characteristics of the databases — our own and others. We have to think carefully about which data fit our question, about the strengths and weaknesses, about what’s best or optimal for our needs, and about what caveats we need to present.
That brings me to another challenge that all of you are aware of, and that is that we have to figure out — all of us — how to balance this increasingly deep knowledge that we have about the complexity of these multiple data sources and approaches, on the one hand, with the reality that some of our key audiences will not want to take part in discussions about these comparative exercises, on the other. Eric Beinhocker noted last evening that Tony Atkinson wanted to produce excellent science, of course, but he also wanted to produce work that would be of use outside of academia. I think it’s fair to say that most of us share that hope. Yet we also know that when, for example, journalists, social activists, or policymakers call us wanting information on inequality outcomes, one answer that is not welcome is: “Well, it’s complicated.”
So, we face that collective challenge: how to balance scientific integrity with relevance. I will end by saying, let’s keep talking and, with that, I will close.

Read More: