
In this post, Joseph van der Naald, a Stone Center research assistant and a doctoral student in Sociology at the Graduate Center, discusses the chapter of the recently published Measuring Distribution and Mobility of Income and Wealth (University of Chicago Press), that he co-authored with Sarah Bruch of the University of Delaware’s Biden School of Public Policy and Administration, and Janet Gornick, director of the Stone Center. Measuring Distribution is part of the National Bureau of Economic Research Studies in Income and Wealth series.
By Joseph van der Naald
Inequality in program spending and recipiency is the product of the federalized design of U.S. social policy, whereby individual states are granted substantial power to determine who is eligible to access social programs and how much they will receive in assistance. The degree of financing, rulemaking, and administrative discretion afforded to states varies considerably depending on the program. States possess higher levels of discretion over cash assistance programs like Temporary Assistance for Needy Families (TANF), which provides income support to poor families, than over food assistance programs — such as the Supplemental Nutrition Assistance Program (SNAP) — and child health insurance programs. For example, while TANF is a means-tested program with federal guidelines that requires most recipients to be employed, the nature of these work requirements (the kind of work, its frequency, when the requirement is implemented, etc.) is left up to state governments to determine.
Figure 1. Categorization of Safety Net Programs by Levels of State Discretion
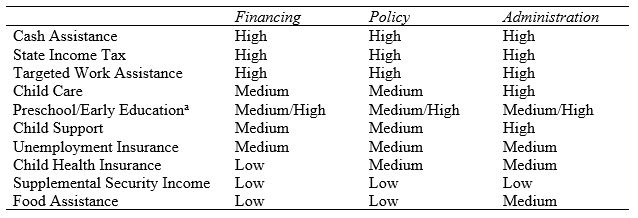
Note: Low=limited state discretion; High=a great deal of state discretion. Authors’ coding based on program design features distributing federal and state responsibilities and authority (see Bruch, Meyers, and Gornick 2018 for more details on discretion coding).
a Combines programs operating with different forms and degrees of state discretion: state funded Pre-K programs, over which states have full control, plus the federal Head Start program that is funded and managed directly by federal agencies.
This form of policy decentralization has produced a geographic unevenness in social provisioning with dire consequences for the well-being of many individuals in need. Our research uses 2018 data on households with children from the State Safety Net Policy (SSNP) dataset — a cross-state, over-time dataset constructed by our team — to document substantial disparities in the extent of social safety net benefits across states. Both the generosity of social programs, calculated by dividing a state’s total benefit spending by its program caseload, and the inclusivity of programs, calculated by dividing the number of actual program recipients by the number of potentially needy individuals or families in a state, vary substantially across states. TANF stands out in this regard: the most generous states on average provide more than double the amount of annual cash assistance to poor families than do the least generous states ($6,500 versus $2,000, results not shown here). And yet only a fraction of eligible households even receives those benefits. Among the least inclusive states, a meager 5 percent of eligible households get TANF, while even in the most inclusive states only 40 percent of those eligible are recipients.
Using Gini coefficients, we further show that the degree of variation in states’ average measures of program generosity and inclusivity corresponds to the level of discretion these programs afford to states in terms of their financing, the determination of their eligibility criteria, and their administration. Food assistance (SNAP) and Supplemental Security Income (SSI), located at the bottom of Figure 2, are two programs with the least state discretion, and consequently they display a greater degree of uniformity in terms of their generosity and inclusiveness.
Figure 2. Cross-State Inequality in Safety Net Provision Generosity and Inclusion, 2018
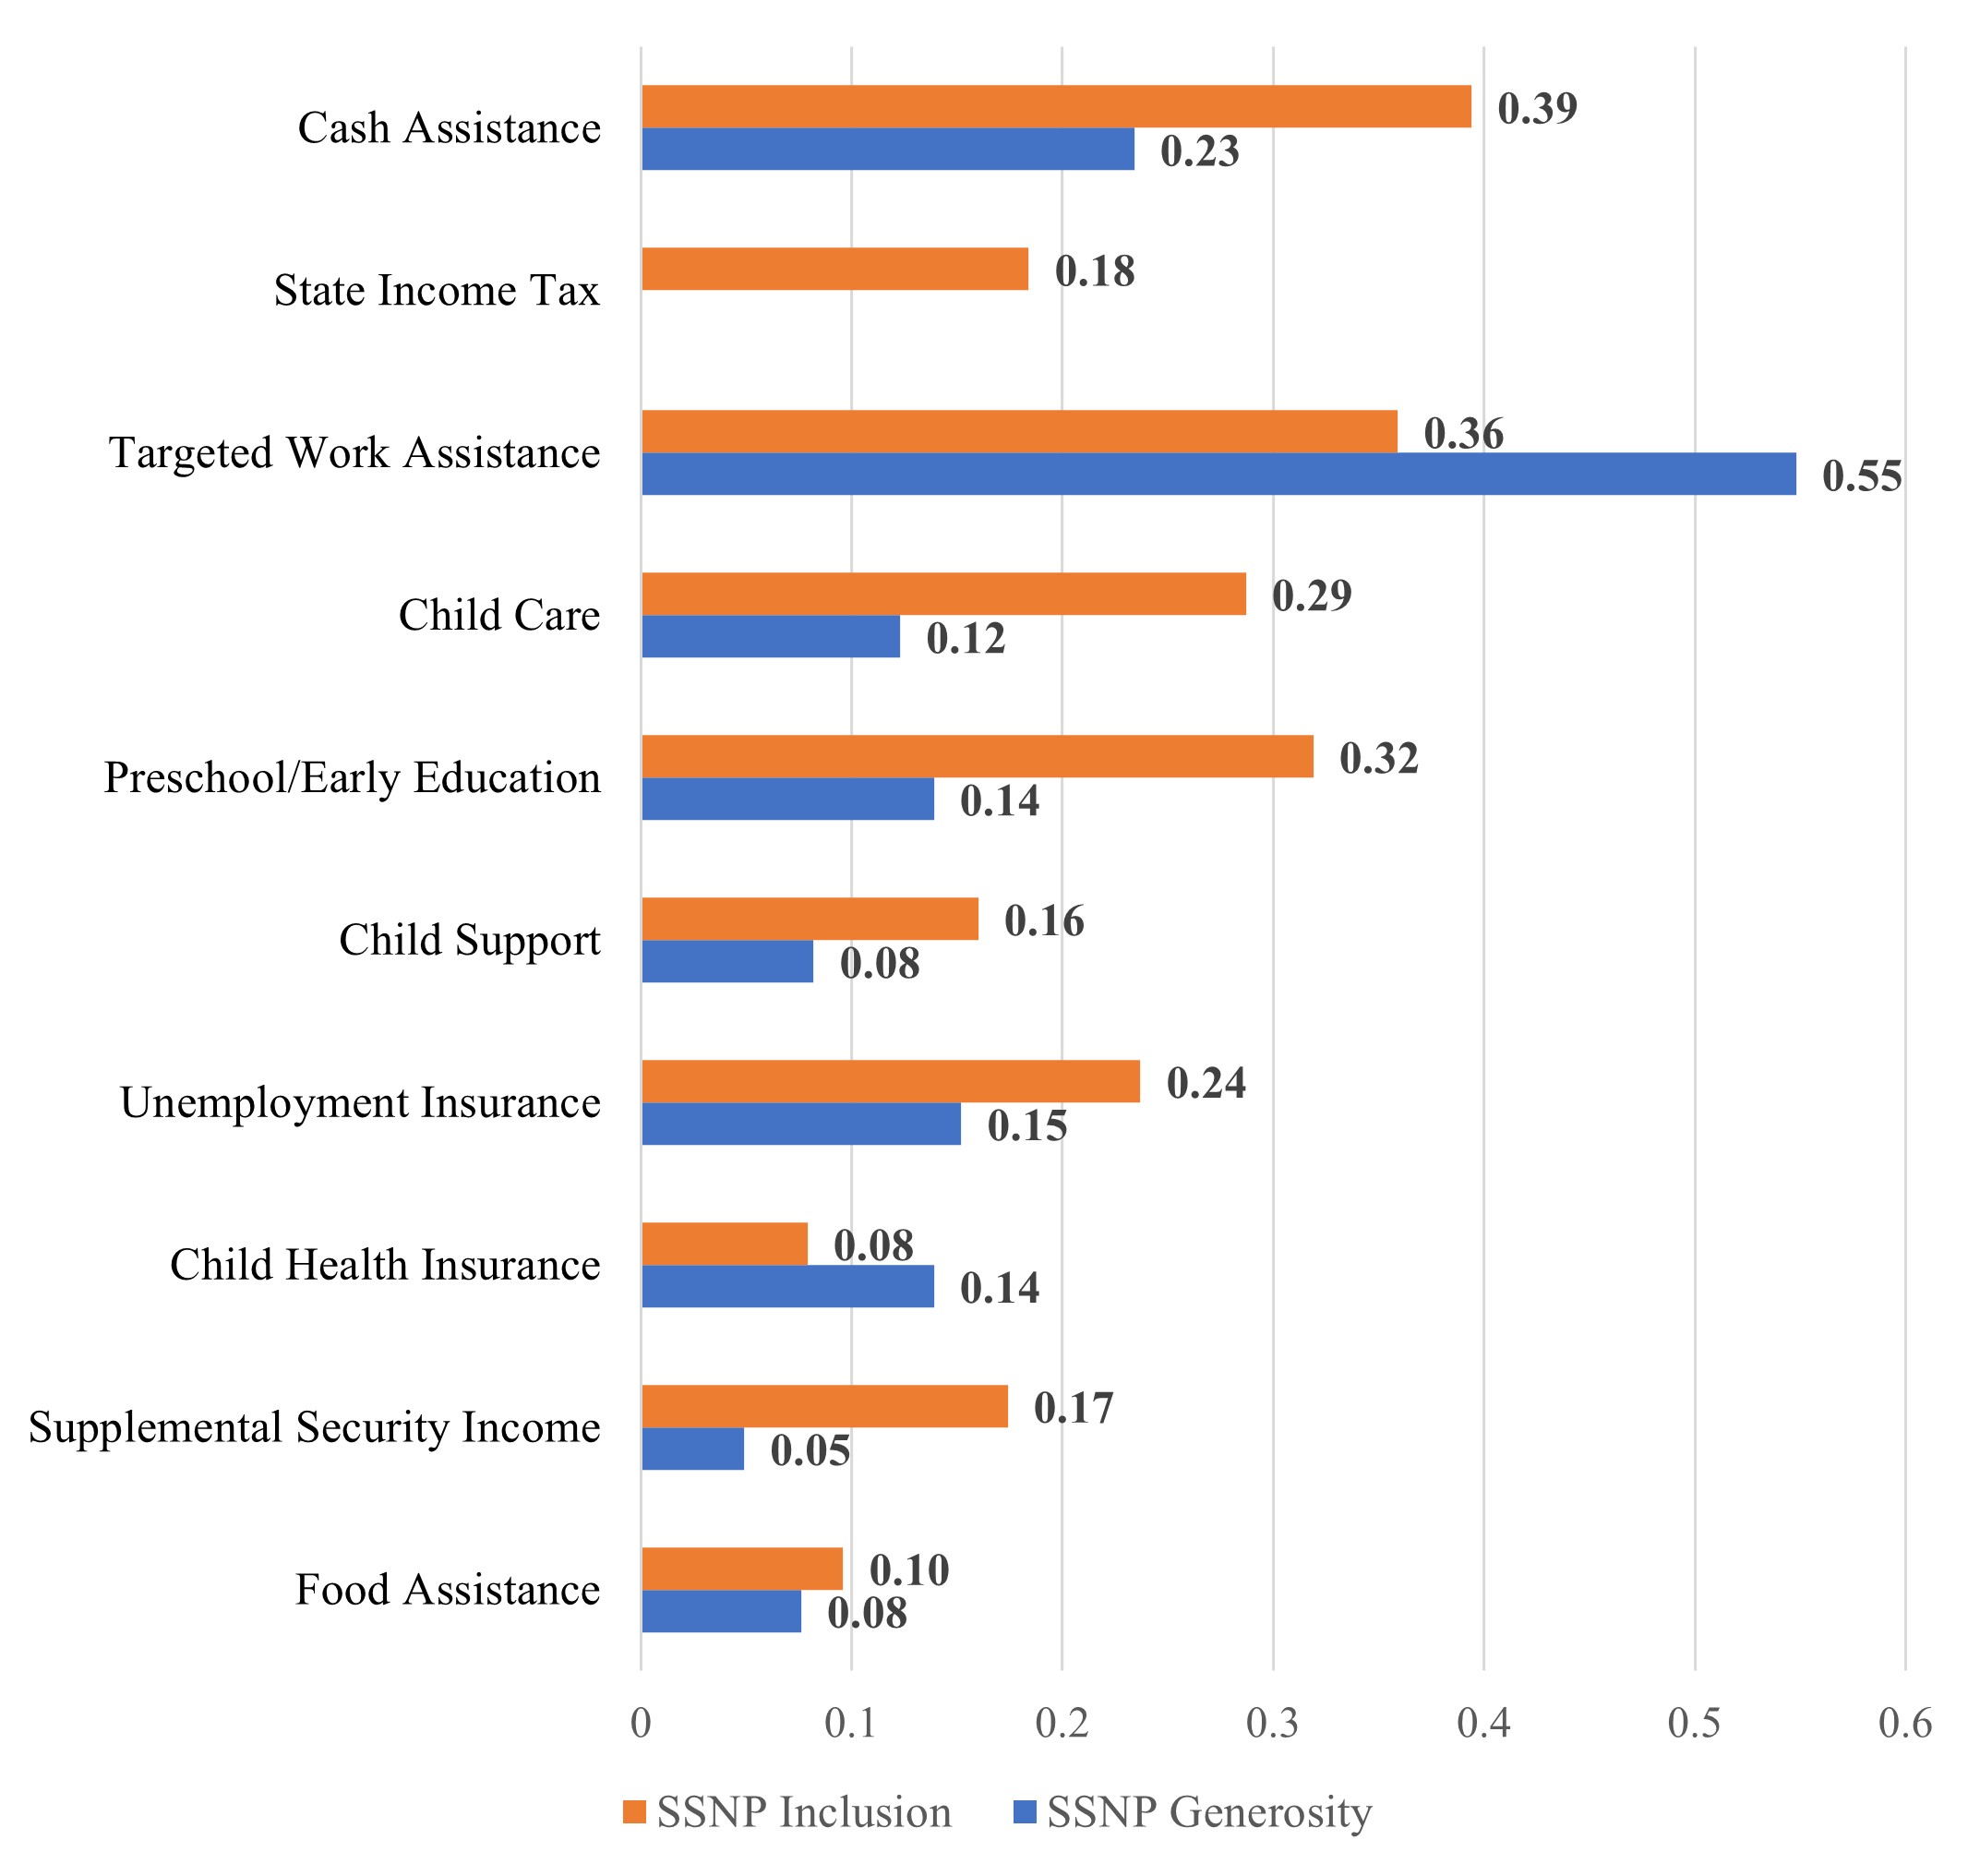
Note: Programs are ordered by overall level of state discretion in financing, administration, and rule-making. The state income tax generosity measure includes several negative values (which indicate tax liabilities) therefore no Gini coefficient is calculated.
Finally, we explore how states’ measures of program generosity and inclusivity correspond to their demographic composition. Among the correlations that we discuss in our chapter, two best illustrate the complex consequences of the U.S.’s decentralized safety net. First, we find that in states with greater percentages of African American residents, TANF is on average less generous and serves fewer eligible individuals. Conversely, we find that in states with larger percentages of African American residents, SSI benefits tend to be more generous and display greater levels of inclusivity. While our analyses do not provide a systematic explanation for these patterns, we note that the federal government sets the benefit levels for SSI payments and establishes the program’s eligibility guidelines using medical determinations of disability. TANF, on the other hand, provides states substantial discretion in both setting benefit payment levels and, as reviewed above, establishing eligibility guidelines. We suggest, therefore, that the design of U.S. social policies, affording states varying levels of discretion over the financing, rulemaking, and administration of safety net programs, has yielded considerable inequalities in the fortunes of poor families in general, and among Black families in particular. Moreover, our work echoes other scholarship that has documented lower levels of TANF spending in states with higher proportions of Black residents, as well as an inverse relationship between TANF and SSI spending. Our contribution to this literature is to emphasize that these disparities are systemic, and the byproduct of the social safety net’s decentralized architecture.
Figure 3. Cash Assistance (TANF) Generosity and Inclusion and State African Population, 2018
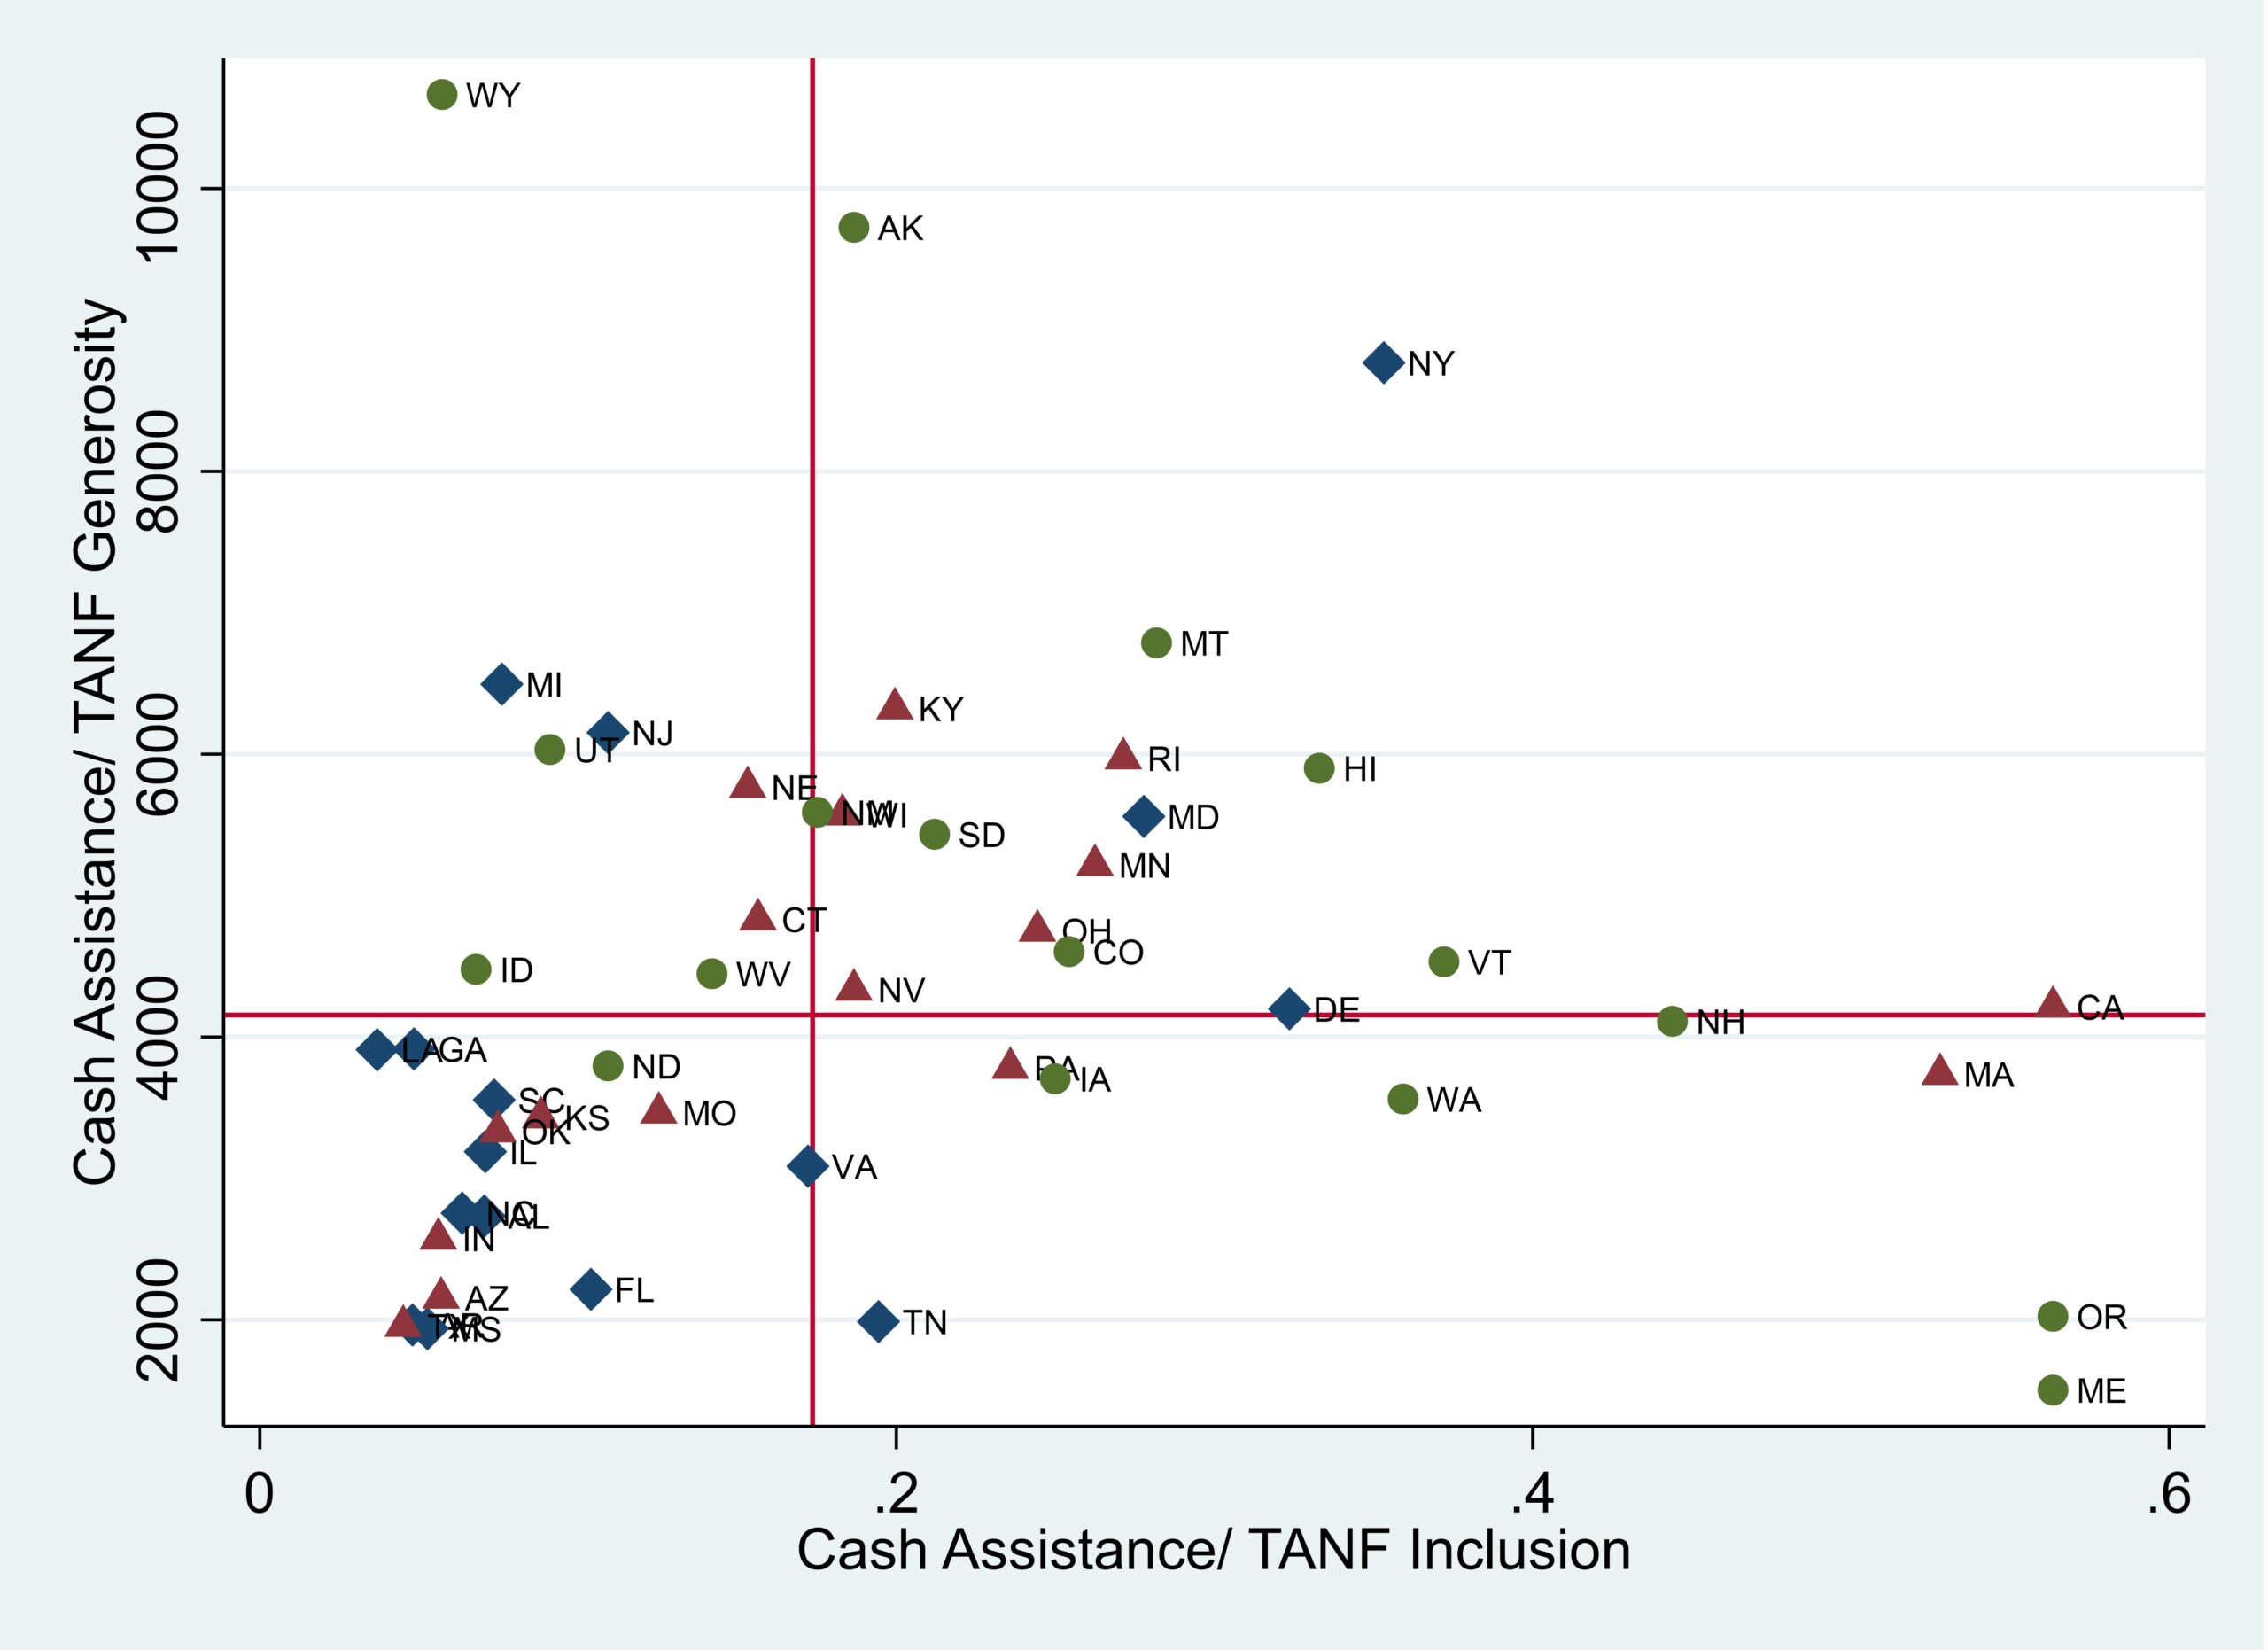
Note: States are classified by Black population percentages (diamond indicates high tertile — i.e., top third — of the distribution, triangle indicates medium/middle tertile, circle indicates low/bottom tertile). The lines in the graph represent the 50 state median values of inclusion and generosity.
Figure 4. Child Supplemental Security Income (SSI) Generosity and Inclusion and State African American Population, 2018
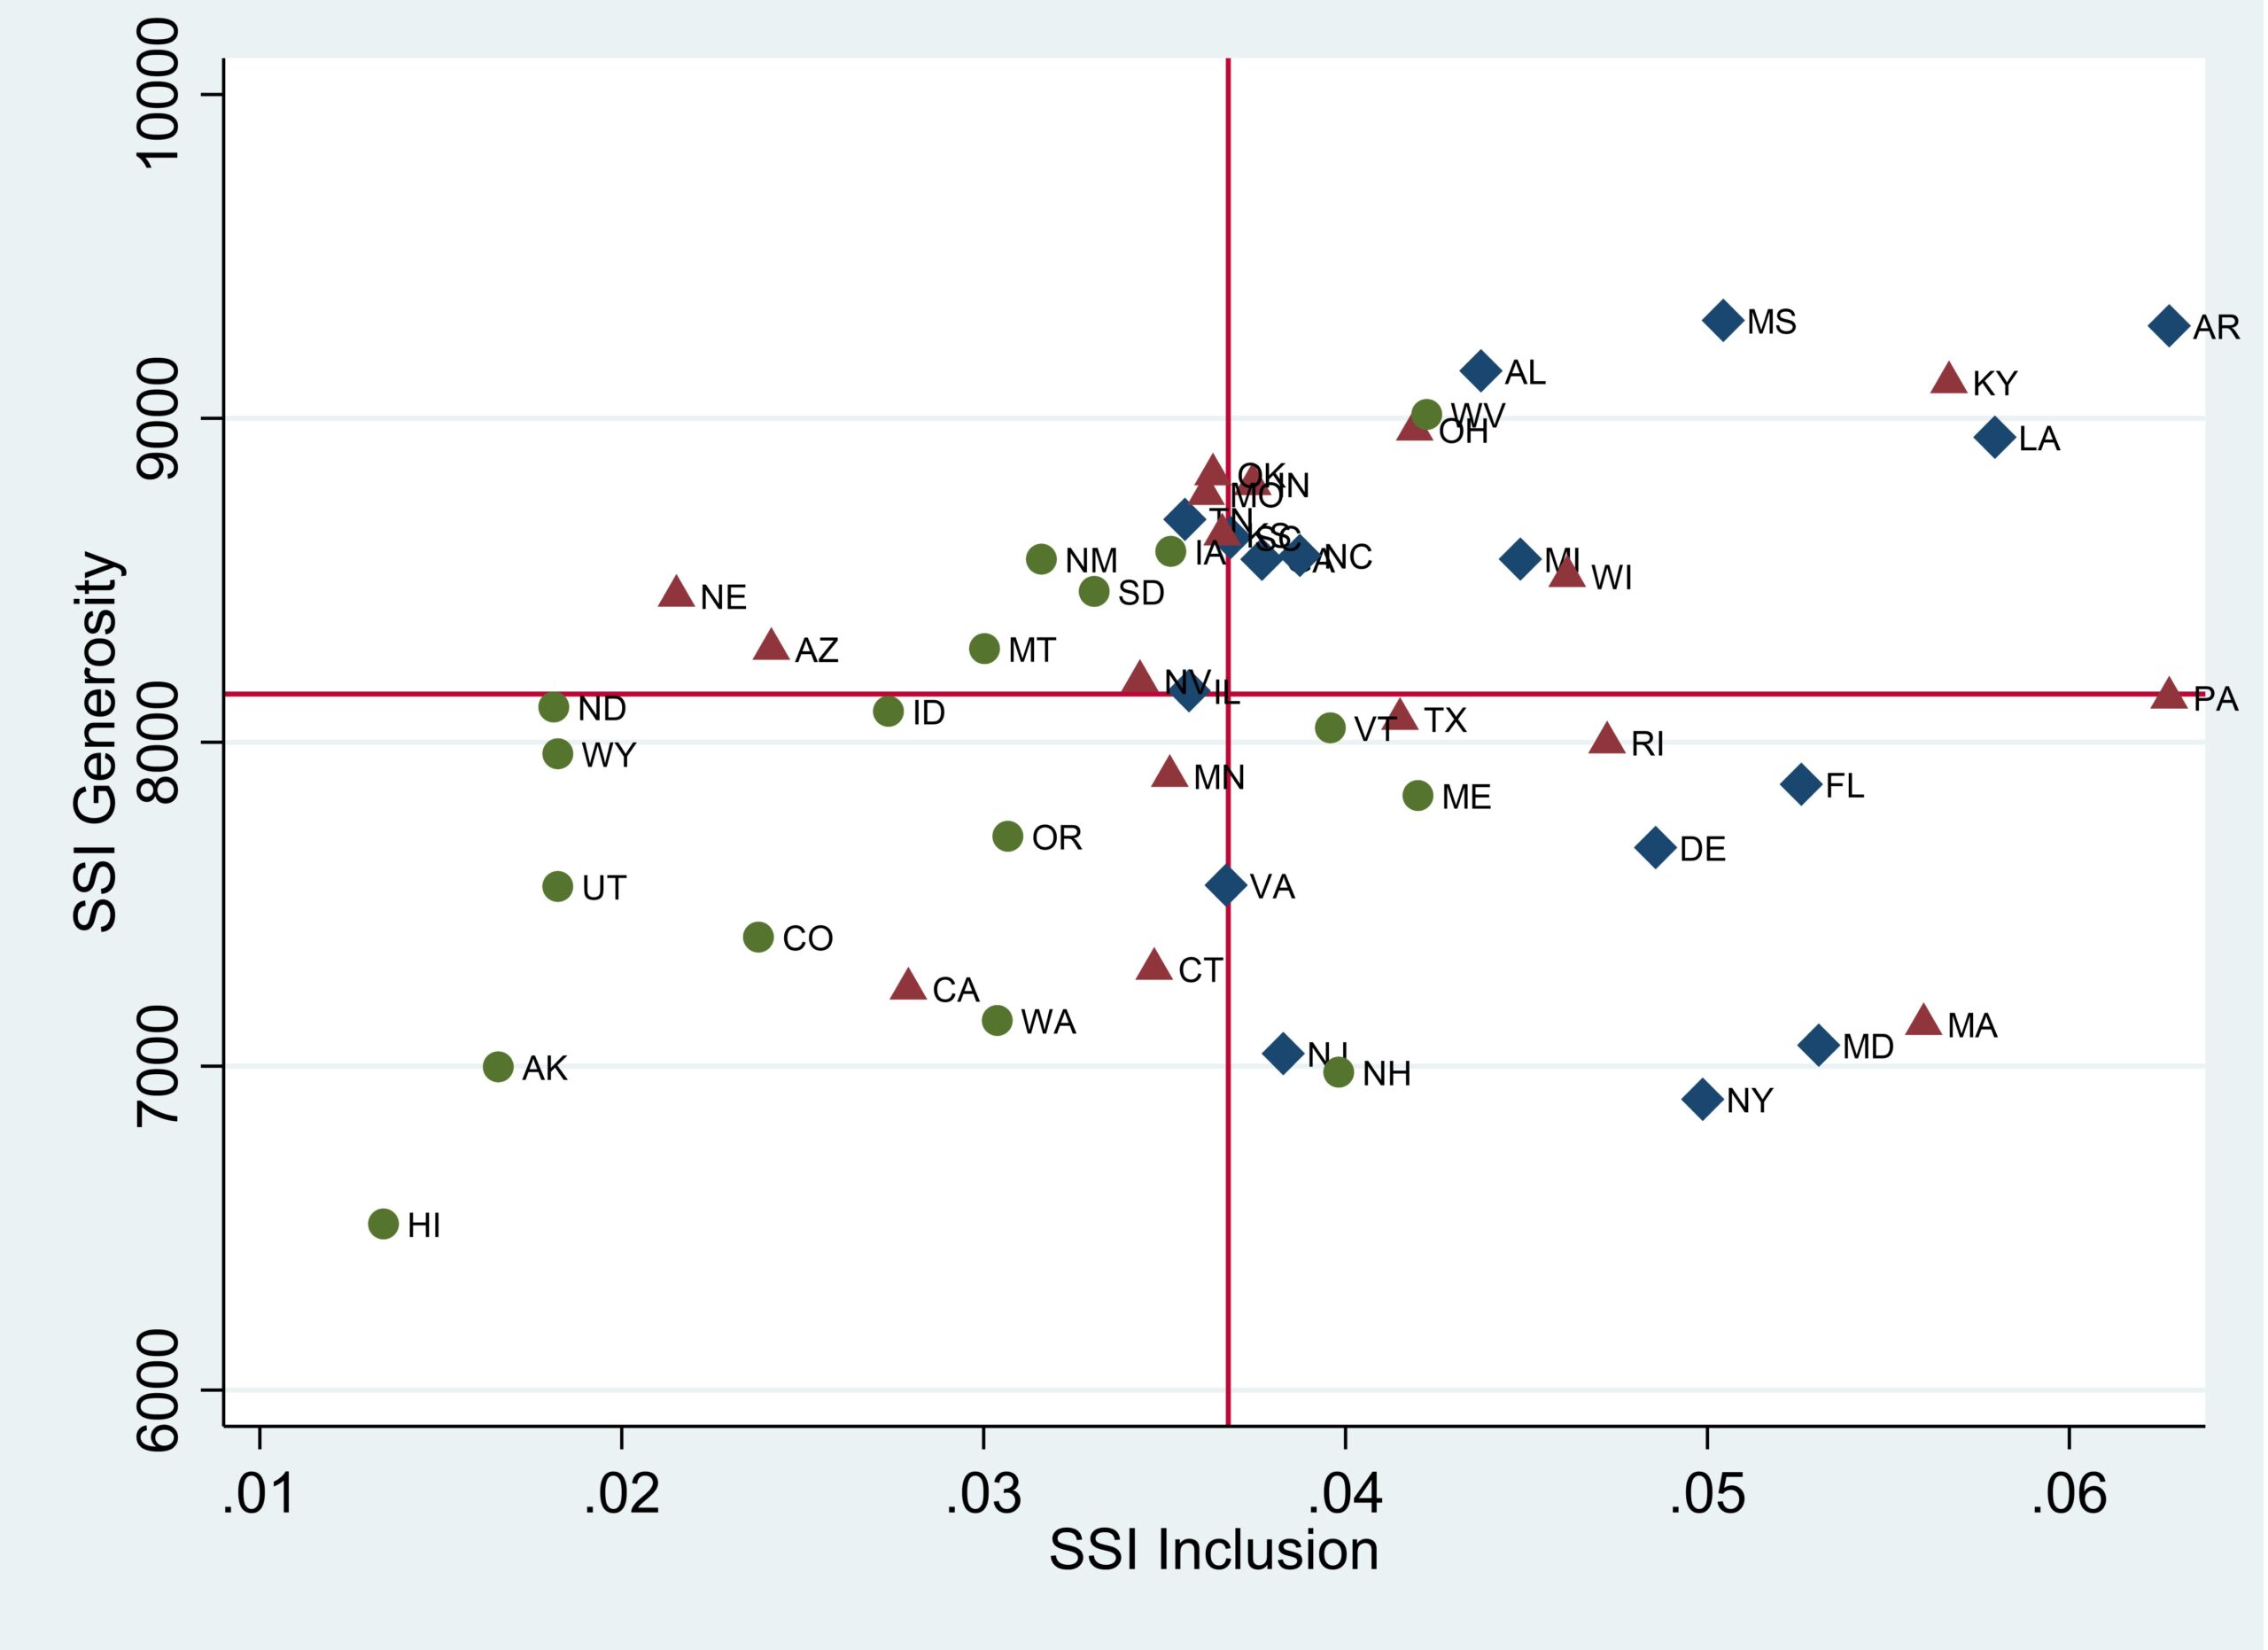
Note: States are classified by Black population percentages (diamond indicates high tertile — i.e., top third — of the distribution, triangle indicates medium/middle tertile, circle dicates low/bottom tertile). The lines in the graph represent the 50 state median values of inclusion and generosity.
The work in this volume was first presented at a NBER conference cohosted by the Stone Center in March 2020, shortly before the Covid-19 pandemic engulfed the U.S. The pandemic’s economic impact has only magnified the relevance of the research reported in the volume, as editors Raj Chetty, John Friedman, Janet Gornick, Barry Johnson, and Stone Center Affiliated Scholar Arthur Kennickell note in their introduction. As new research continues to reveal the uneven impact of the Covid-19 pandemic on U.S. households, and in particular the ways in which the pandemic both revealed and intensified existing racial inequalities, we think it is imperative to scrutinize how the design of the U.S.’s decentralized safety net facilitates geographic disparities in economic well-being. Several components of the Coronavirus Aid, Relief, and Economic Security Act (CARES) Act, which alleviated poverty for millions of people during the pandemic’s first year, were delivered to households directly through federal relief programs. Though these program expansions have since been terminated, they suggest a different and potentially more equitable path forward for U.S. social provision unmitigated by the machinations of state politics.
Read More:
- Geographic Inequality in Social Provision: Variation Across the U.S. States
- Measuring Distribution and Mobility of Income and Wealth
- Poverty Reduction Through Federal and State Policy Mechanisms: Variation Over Time and Across the U.S. States