
November 19, 2024
A new working paper by Pirmin Fessler of the Austrian National Bank (OeNB) and Stone Center Postdoctoral Scholar Severin Rapp analyzes the connection between individuals’ biased perceptions of their rank on the wealth distribution, and their savings behavior.
What determines how much money an individual saves? One factor, according to a new paper by Pirmin Fessler and Severin Rapp that was recently added to the Stone Center Working Paper Series, is the individual’s perception of their rank on the wealth distribution. This finding stands in contrast to conventional economic theory, which holds that an individual’s actual wealth or income, rather than their perception of it, shapes their savings behavior.
Although many studies have focused on perceptions of rank in the income distribution, few have focused on perceptions of relative wealth. To conduct their study, Fessler and Rapp drew on the Austrian Household Finance and Consumption Survey (HFCS) to obtain data on household economic behavior and elicit the wealth rank perceptions of the population. Their analysis showed a significant bias in how individuals rank themselves on the wealth distribution, with a strong pull toward the middle: individuals who fall in the lowest tercile of the wealth distribution tend to overestimate their rank, while individuals in the upper two terciles tend to underestimate. In addition, individuals’ perceptions of their relative wealth tend to be less accurate than perceptions of their relative income, the researchers found.
The study also showed that these misperceptions influence economic behavior, and that the effect is strongest among individuals who underestimate their rank on the wealth distribution: the savings rate of “underestimators” is approximately 50 percent higher than that of individuals who accurately estimate their rank. Underestimating one’s rank by one decile corresponds to a 0.8 percentage point higher savings rate, the researchers found. However, the effect is not linear: “overestimators” do not tend to save less.
Average savings rate across the income distribution
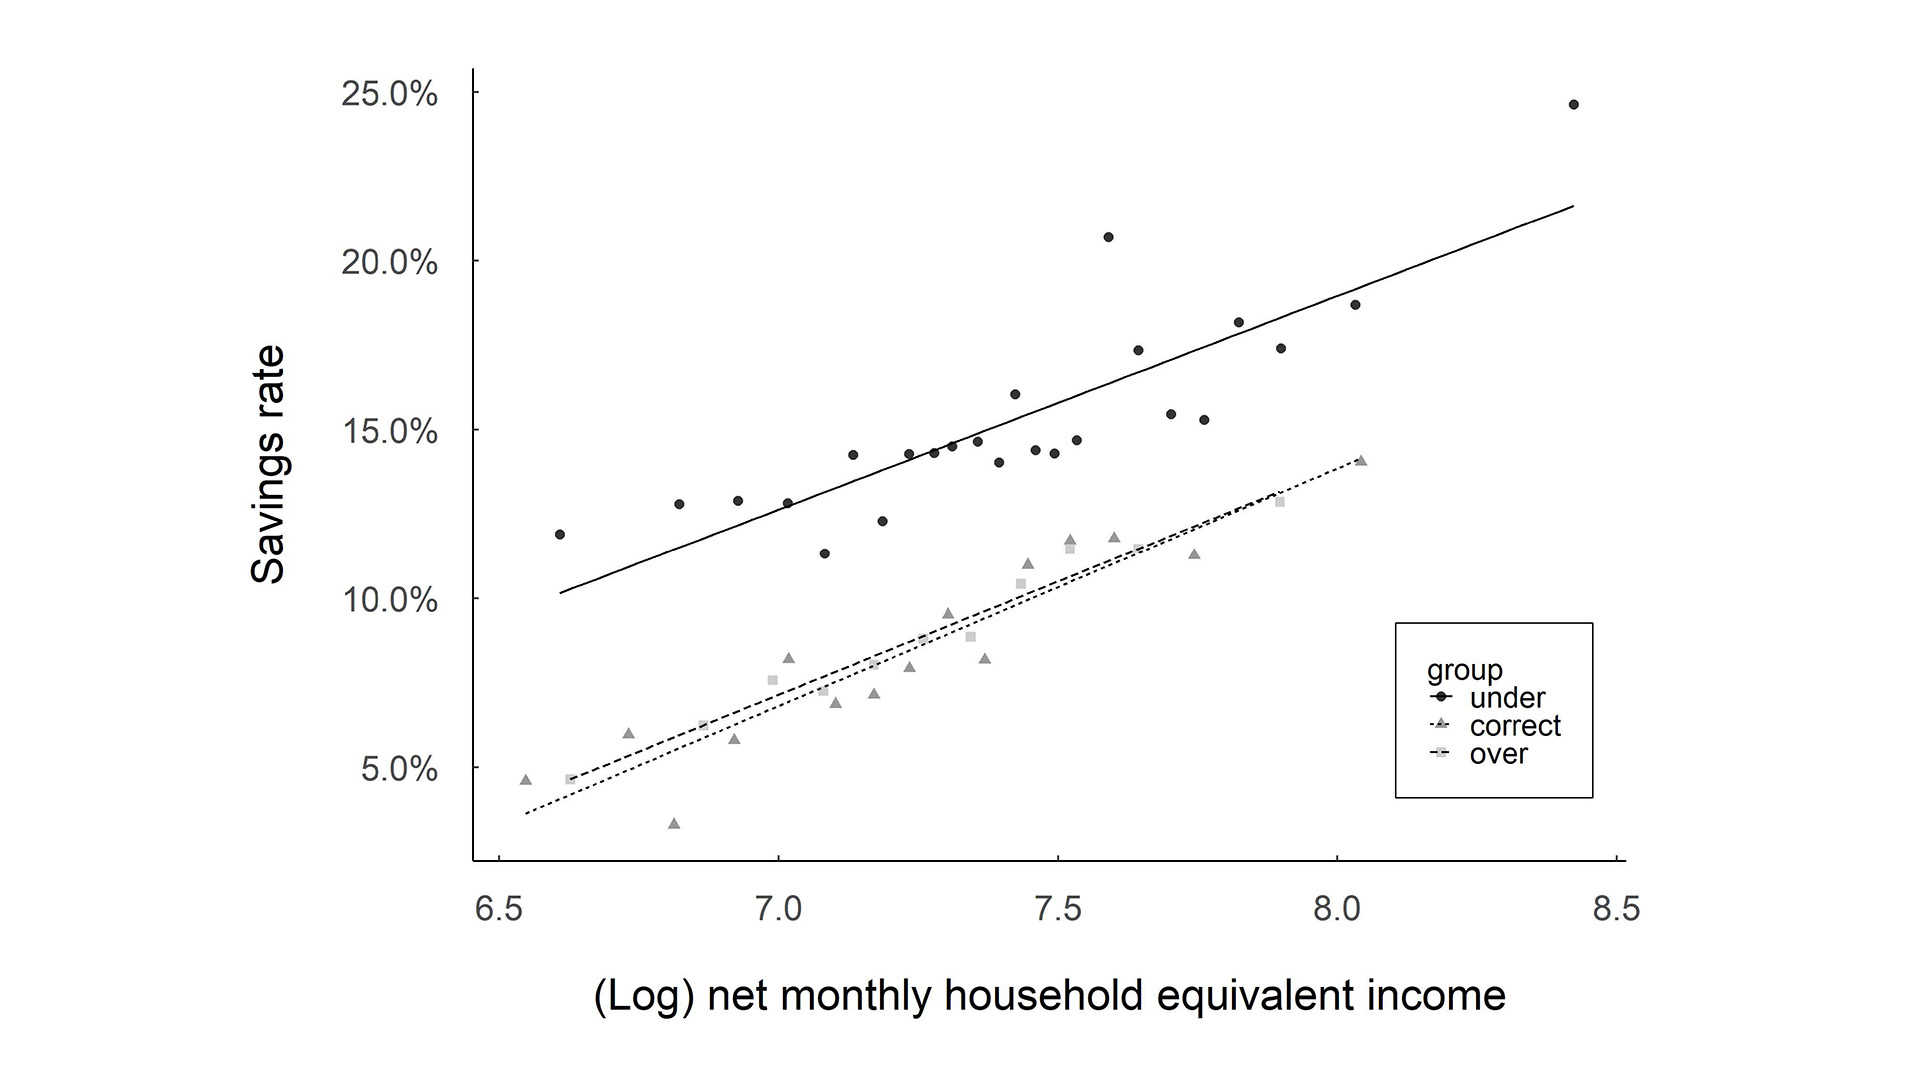
Note: The x-axis refers to equivalized monthly household net income. The y axis represents monthly savings as a fraction of household net income. The solid line plots the relationship between income and savings for individuals who underestimate their household’s position in the wealth distribution. The dashed line refers to overestimators. The dotted line is the savings rate as a function of income for individuals with correct assessments. Estimates are constructed from averaging across implicates. Survey weights are taken into account. Source: HFCS 2014, 2017 – ECB and OeNB.
What causes these misperceptions? The researchers speculate that information bubbles — reinforced by residential segregation based on income, and consumption of social media — are limiting individuals’ awareness of the actual wealth distribution in Austria. “People are increasingly mixing with those who are very similar,” explains Rapp. “As a result, people are more likely to think that their wealth is more representative of other people’s wealth rather than an extreme value.”
These findings have implications for policy design. Through taxation and spending policies, governments seek to influence household income, consumption, and savings; similarly, monetary policies, such as raising or lowering the interest rates, are aimed at changing how households consume, invest, and save. “Our findings point towards new avenues that governments can explore to manage macroeconomic outcomes,” Rapp says. “If you can change people’s perspective about their relative rank in the distribution, that could have an effect on savings patterns.”
Read the Study:
