
A working paper by Paolo Acciari, Facundo Alvaredo, and Salvatore Morelli uses a novel source to shed light on the wealth distribution from 1995 to 2016.
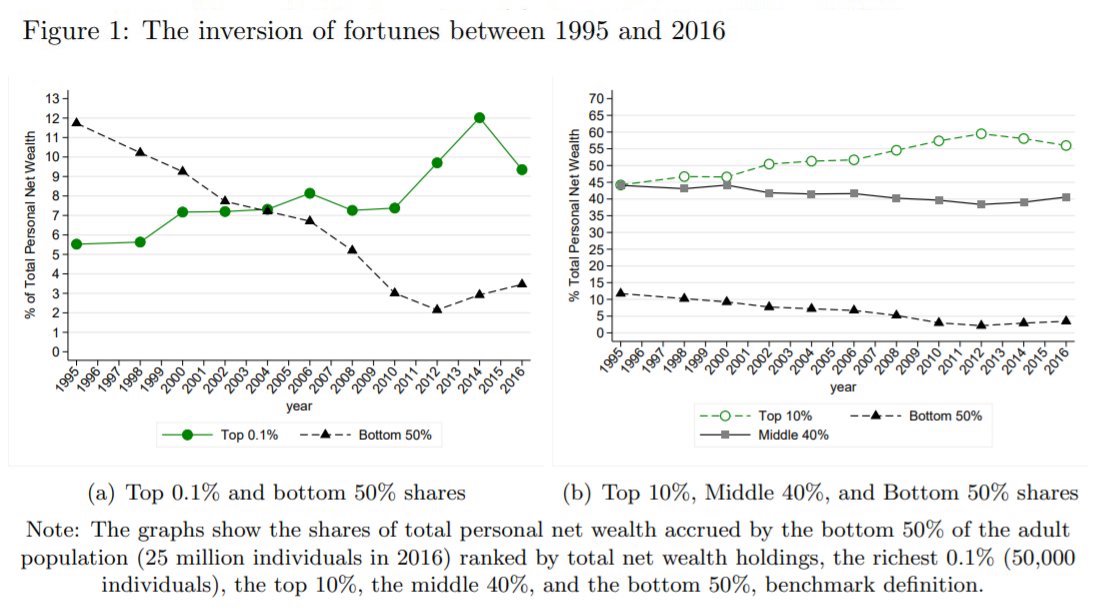
In their new working paper, Paolo Acciari, Facundo Alvaredo, and Salvatore Morelli used Italy’s inheritance tax records to show that the wealth share held by the top 0.1 percent in Italy — the richest 50,000 adults — doubled from 5.5 percent to 9.3 percent from 1995 to 2016. In contrast, the share of wealth held by the poorest 50 percent fell from 11.7 percent to 3.5 percent, with the average net wealth held by the poorest declining by 80 percent.
This work provides the first set of comprehensive estimates of wealth distribution and concentration that complement those from the Survey on Household Income and Wealth (SHIW), administered by the Bank of Italy since the late 1980s. The use of different data sources for the study of wealth inequality is essential, the authors argue, as every source is open to challenge and has different advantages and shortcomings. Moreover, the use of household surveys is generally deemed to be less suited to capture the wealth holdings at the very top for a variety of reasons; this is especially the case with surveys that do not employ over-sampling, a resource-intensive technique used to improve coverage of the wealthiest households (as in the case of SHIW). Other problems include differential non-response and under-reporting rates across wealth classes.
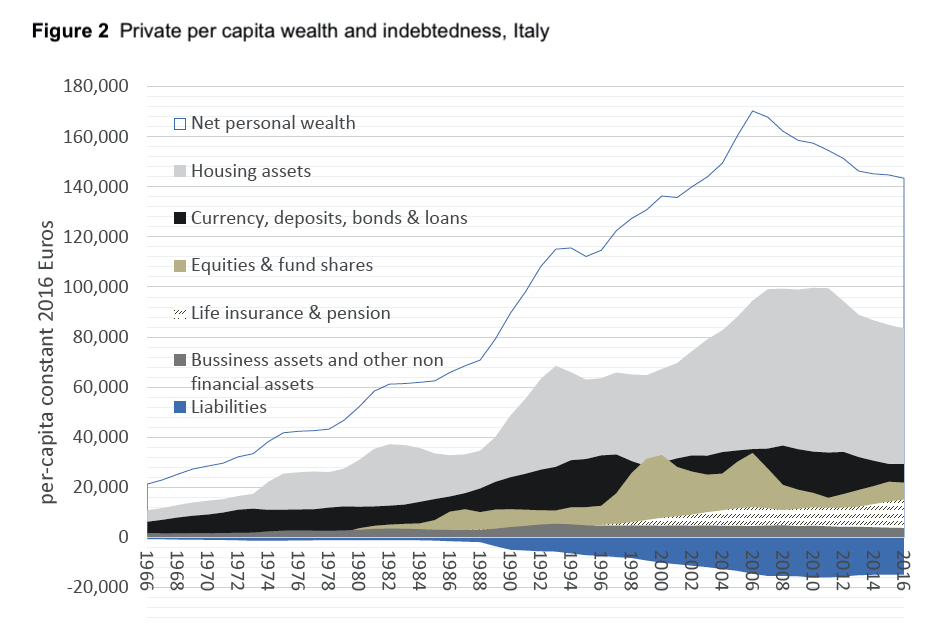
Italy has one of the highest wealth-to-income ratios among high-income countries (the total value of household net wealth, approximately 8.5 trillion euros, is worth about seven years of national income) yet before this paper, very little was known about the distribution of this wealth.
The level of wealth concentration observed in Italy appears to be in line with other European countries such as France, Spain, and Germany, the researchers found. However, with respect to its time evolution, the wealth concentration is closer to that found in the United States.
Whereas the share of wealth held by the Italian middle 40 percent remains relatively high, the share of the bottom 50 percent — composed of approximately 25 million individuals — experienced the strongest decline since the mid-1990s, compared to other countries.
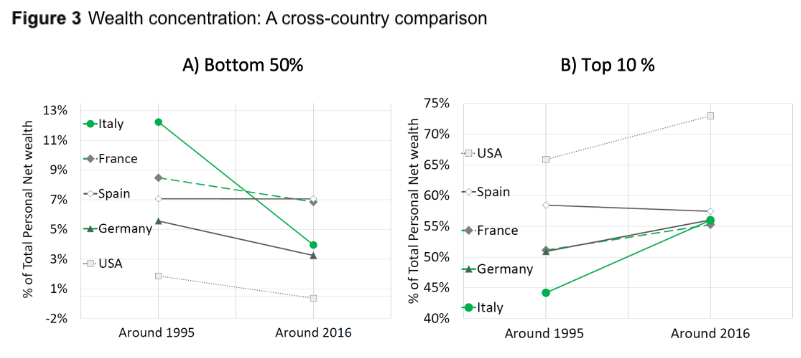
Note: The figure compares the evolution of wealth inequality from around 1995 to around 2016 for countries for which we have series comparable to our benchmark. Italy is based on the authors’ results; Spain comes from Martínez-Toledano, 2017; France from Garbinti et al., 2016; Germany from Albers et al., 2020; and the U.S. from Saez and Zucman, 2016. “Around 1995,” refers to 1995 for all countries except Germany (for which it refers to 1993). “Around 2016” refers to 2014 for France and the U.S., to 2015 for Spain, to 2016 for Italy, and to 2018 for Germany.
The benchmark approach adopted in their study is to distribute (hence impute missing wealth when needed) the full balance sheet of the household sector from the National Accounts (along the lines of the Distributional National Accounts framework). This is based not on the assumption that the balance sheet gives the correct numbers, but that it provides a reasonable indicator (enshrined in official statistics) of the development of aggregates over time and offers the possibility of better cross-country comparison.
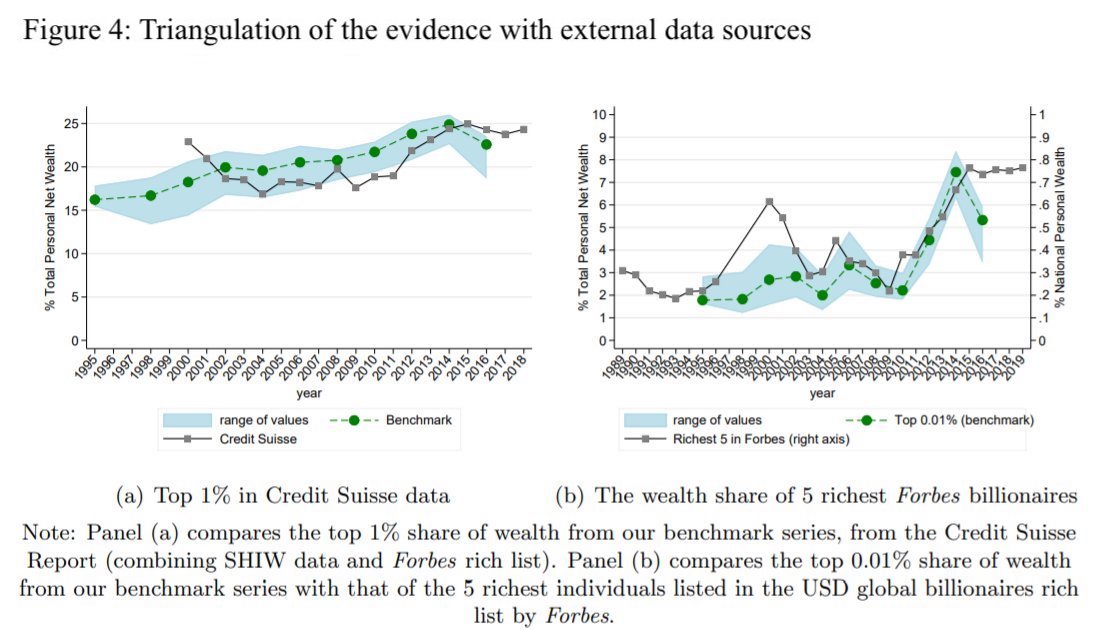
Their series are triangulated with external evidence: the global Forbes Billionaires List and data from Credit Suisse (which combines data from the Survey on Household Income and Wealth with Forbes data). For example, using the Forbes list, they were able to track the evolution of the share of the five richest individuals since 1988. The picture is broadly consistent with the benchmark series.
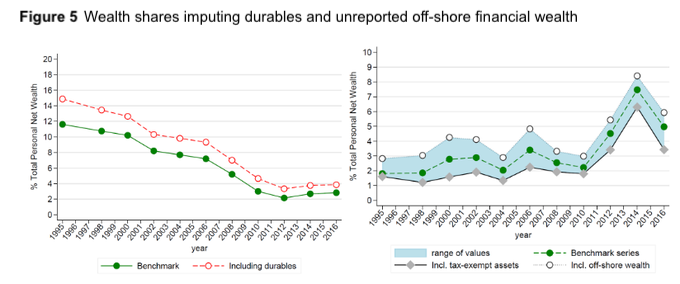
They also checked what happens when they include some assets that are missing from the official National Account records, despite their relevance for households, such as vehicles and other durable goods (which account for approximately 8 percent of total wealth identified in the 2016 SHIW data), as well as unreported financial assets stashed in offshore accounts (estimated to be about 2 percent of personal wealth). Clearly, the exclusion of durables can have different implications for inequality estimates than the exclusion of financial assets stashed in offshore accounts. See the effect on bottom 50 percent and the top 0.01 percent:
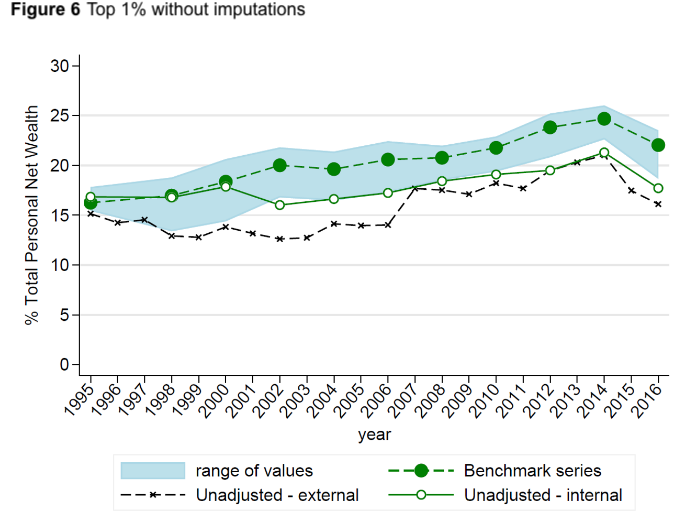
They also produced series based on inheritance tax data alone before any imputations (which can be controversial), as is done in the literature by simply applying the “classic” estate multiplier method.
They argue that, given the current imperfect state of data on the distribution of assets and liabilities, presenting the benchmark series in the context of a wider range is preferable to the alternative option of looking at one series resulting from a single source.
They also attempt to shed light on the determinants of wealth inequality trends. In doing so, they make additional contributions to the literature. First, they highlight that although average wealth grows with age, the dispersion of wealth within each age (and gender) group is not too dissimilar from that within the overall population. Second, they also provide new evidence of asset portfolios across the distribution: Wealthy Italians hold the greatest portion of their portfolios in financial and business assets.
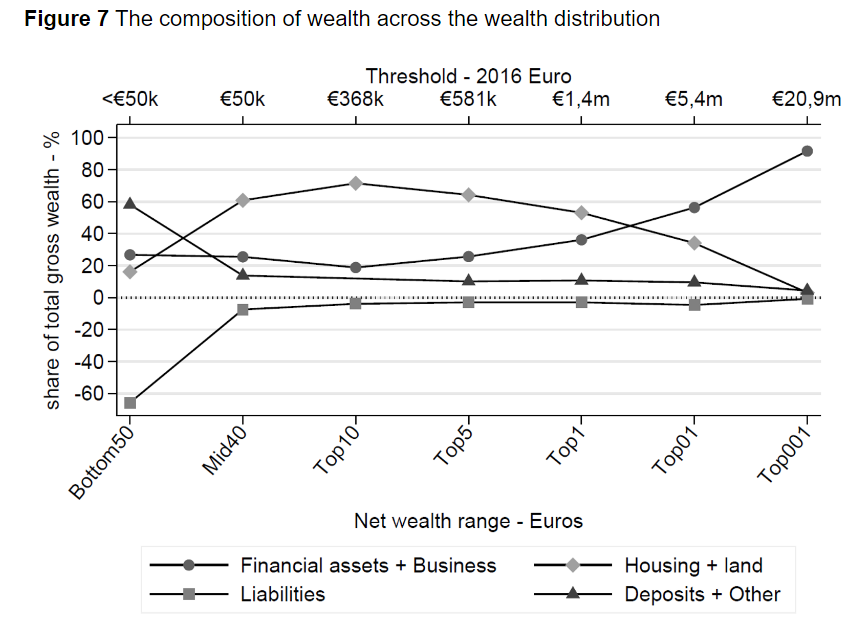
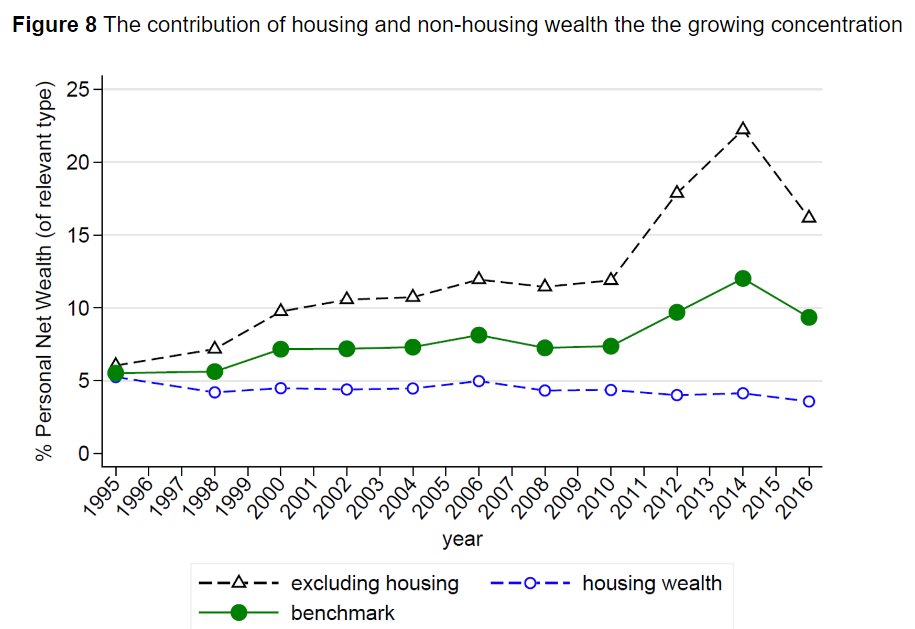
In line with these findings, they show that the wealth shares of all groups above the 90th percentile are mostly driven by the dynamics of non-housing assets.
Lastly, they provide new evidence on the growing role of inheritance and gifts inter vivos as a share of national income, as well as their increasing concentration at the top.
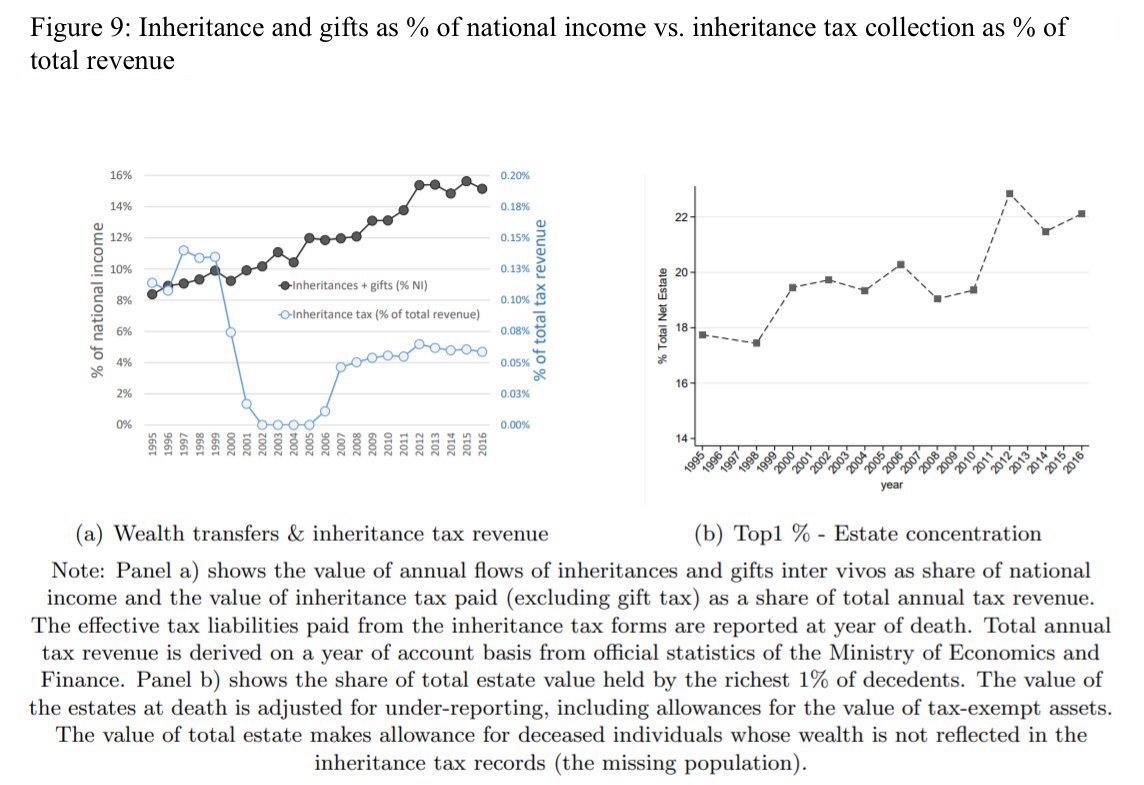
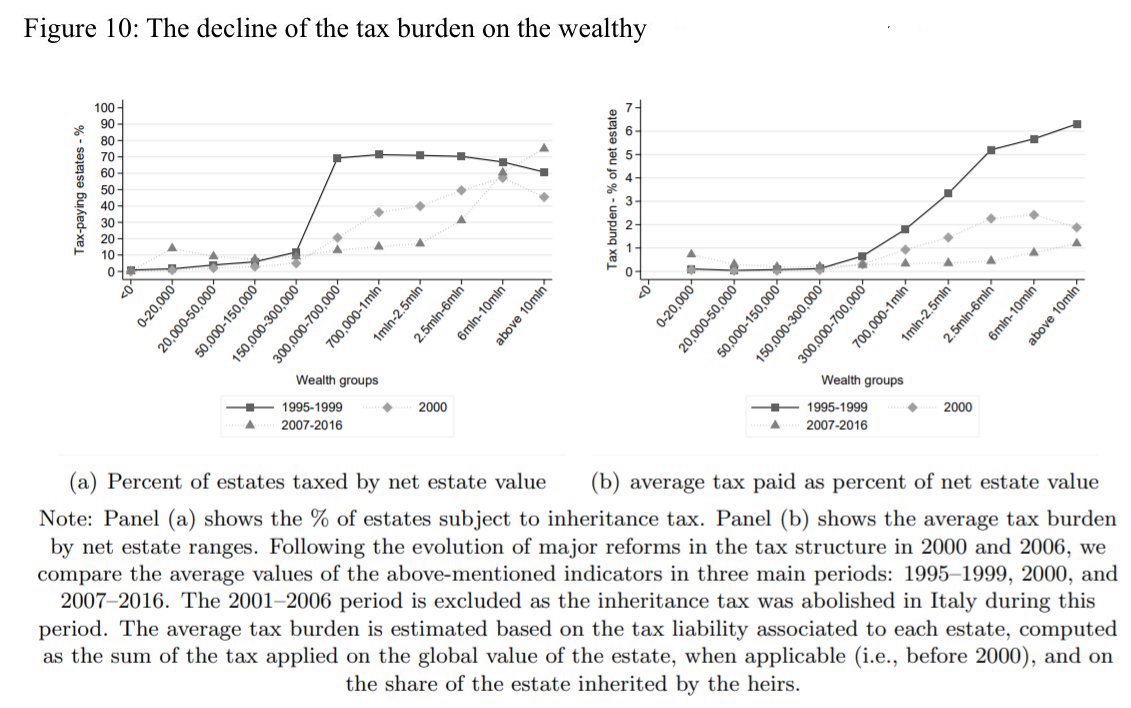
In line with these trends, the researchers show that wealthy inheritors were subject to an overall decreasing tax burden over the past 20 years. Lower proportion of large bequests are subject to taxation today and their average tax burden has shrunk.
Read the Paper:
“The Concentration of Personal Wealth in Italy 1995–2016”
Additional reading:
“The Growing Concentration of Wealth in Italy: Evidence from a New Source of Data,” by Paolo Acciari, Facundo Alvaredo, and Salvatore Morelli
A note on the measurements and data:
The only existing source of data currently available in Italy to estimate wealth distribution is the household survey data (SHIW). This source suggests an almost flat evolution of wealth inequality since 1995, with the wealth share of the top 1 percent of individuals remaining at roughly 14 percent.
The researchers argue that the use of inheritance tax data (never previously used in Italy) increases the probability of better covering high-end groups, even without adjustments and despite tax avoidance and evasion behaviors. The data, between 1995 and 2016, cover up to 63 percent of the deceased.
The data have advantages but, as usual, many disadvantages too. Several adjustments are applied to the data. First, real estate cadastral values have to be brought in line with market prices. When they do that, total real estate wealth pretty well matches National Accounts data.
Second, the number of decedents and their wealth need to be multiplied by the inverse of the mortality rate (the distribution of decedents needs to be reshaped into the distribution of identified living wealth holders): this is the classic mortality multiplier method.
Third, allowances must be made for the wealth of the unidentified population in the tax data. And fourth, imputations are needed to account for tax exempted assets (e.g., government bonds, pensions, and life insurance), for differences in valuation, and for tax evasion.