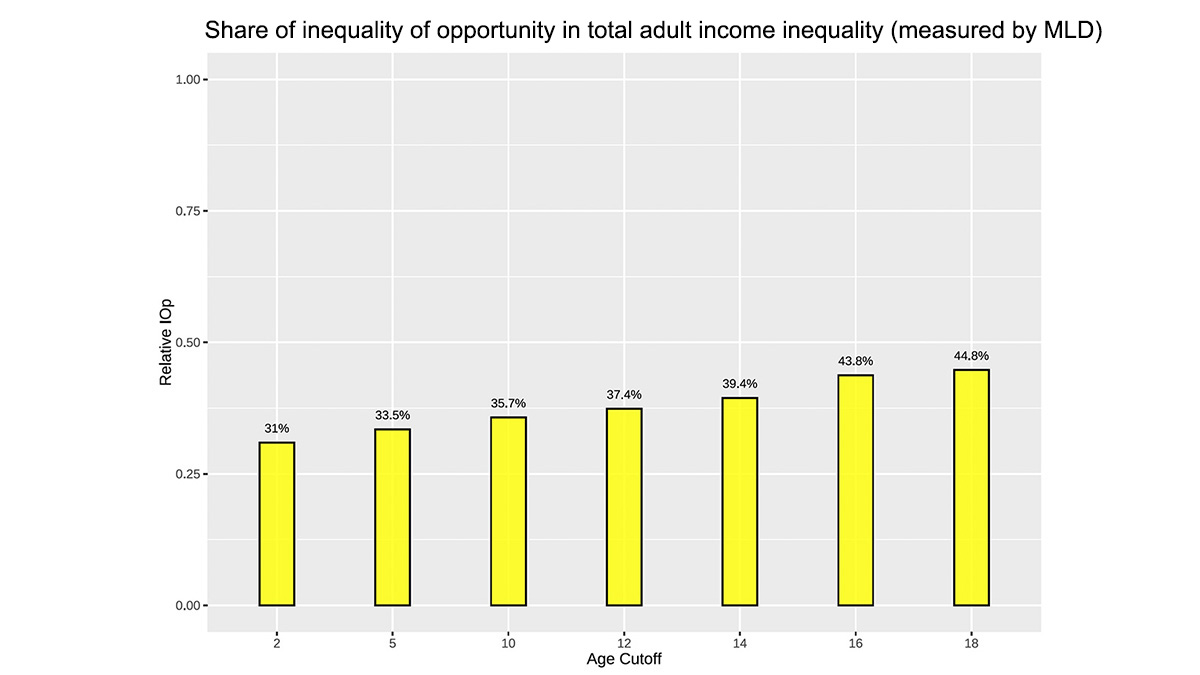
Graph – Share of inequality of opportunity in total adult income inequality – 1200×675 2 Fisher, Carolyn2024-12-17T16:58:53-04:00December 17, 2024|