
Stone Center Affiliated Scholar Arthur Kennickell worked for more than three decades at the Federal Reserve Board, where he is best known for developing and leading the Survey of Consumer Finances. This is third in a series of three blog posts by Kennickell, which together give a broad overview of the measurement of personal wealth, largely through household-level surveys, and the use of such data to gauge inequality.
In this final post, Kennickell looks at questions related to wealth measurement. (The first post focused on the definition of wealth, and the second on what we mean when we talk about wealth inequality.) The series was written for the recent launch of the GC Wealth Project website, aimed at expanding and consolidating access to the most up-to-date research and data on wealth, wealth inequalities, and wealth transfers and related tax policies, across countries and over time.
By Arthur B. Kennickell
A variety of approaches have been used to gather wealth data for analysis. In some Nordic countries, high-quality administrative data on wealth are available for the entire population. Data from taxation of the estates of deceased individuals have been used to estimate some aspects of the wealth distribution, taking an estimate of the mortality probability of each individual as the probability of selection from the population. There are a variety of private data sources that may have varying breadth of content, typically from populations that are a result of voluntary association of people with the source for the purpose of, for example, managing their personal finances. Many surveys have been designed to collect wealth data along with relevant contextual information, using a probability sample that allows, in principle, for inference to the entire population. There are also hybrid approaches. Each has strengths and weaknesses that must be taken into account when considering its use for analysis.
The discussion that follows focuses on surveys, especially the aspects most relevant for measuring wealth. Two distinct advantages of surveys for collecting wealth data are that the content can include items important for analyzing wealth that are not available in other sources and there is a well-developed mathematical literature that can be used to draw inferences about the entire population from a sample of participants. The downsides to surveys are primarily determined by the behavior of the sample members — primarily, whether they will agree to participate, whether they will pay close attention to and understand distinctions in the survey, and whether they will participate fully and truthfully. The actions of interviewers and other aspects of survey administration may also shape that behavior.
How should wealth be captured in a survey?
The most obvious first step in designing a wealth survey is to define the analytical purposes of the survey, which should determine the relevant concept of wealth and the supporting level of granularity of its components required. The granular components should have an unambiguous definition connected to things that are standardized and, in principle, observable. This stage of effort should also include a determination of the level of approximation that may be tolerable as these conceptual elements are translated into questions to be asked of respondents in a survey. Errors at this stage of planning are usually very difficult, or impossible, to correct fully later.
In designing the actual survey questions, it is important to keep in mind particularly that the ultimate respondents who face the questions may differ in terms of their financial sophistication, ability or willingness to listen or read carefully, or understanding of language. Consequently, it is often the case that what might be a successful approach for one respondent may be confusing, annoying or irrelevant to another. Mindfulness of the range of possibilities is important for limiting the range of errors in understanding and answering the questions. Some examples of possibilities are discussed below. Where possible, cognitive testing of various approaches can be very helpful in avoiding surprises and identifying the best balance.
To build a questionnaire, the conceptual definition of each wealth component must be translated into text and the sequence of questions must be determined. Ideally, each item could be described simply and unambiguously for all respondents. Unfortunately, both because some items can be hard to distinguish simply and because the attention respondents bring to questions about them may differ for the reasons given above. For example, suppose there is a need to collect information on certificates of deposit, money-market accounts and “regular” savings accounts. All three might be thought of as a variety of savings account, but each has a specific set of distinguishing characteristics. Moreover, they may also overlap with other asset types that are relevant; for example, in the U.S. some people use money-market accounts as a checking (sight) account and a money-market account may be either a type of bank account or a type of mutual fund. In asking about each type, a question could include the relevant identifying characteristics of the account and an exclusion, similarly specified, for the other assets that might be incorrectly included. Much experience has shown that such complicated questions can be more confusing than clarifying, and thereby lead to measurement error. One alternative is to sequence the questions in such a way that the most easily specified ones are collected first, in an overall framework that repeatedly maintains that nothing should be recorded more than once. A variety of other approaches might also be appropriate here. Nonetheless, it is rare in such cases that there is one, perfect way to design the questions. More usual is a recognition that some degree of measurement error must be tolerated and the approach to question wording should try to minimize the errors that are most harmful for analytical purposes. There is much art — as well as a good amount of science — in the construction of an appropriate questionnaire text. But there is no substitute for thoroughly testing the questionnaire before executing a survey.
There are many other elements of questionnaire design that can be very important in supporting high-quality data collection, a few of which are considered here. Response rates on questions asking whether the household has a wealth item are typically very close to 100 percent, but obtaining an answer for the amount is often more problematic. A respondent may refuse to answer or say that they do not know the amount. Dealing with refusals requires understanding more about the reasons for the refusal and addressing the underlying concerns—a difficult task to accomplish purely with questionnaire design. Often a respondent who first claims not to know an answer to such a question may still know something. In some cases, the desired value may not be precisely defined without actually selling the item—for example, in the case of privately owned businesses. By allowing respondents the option to give a range of values, instead of a single value, can greatly reduce complete nonresponse due to uncertainty about the true value.
Respondents who are wary of revealing too much private information may also use ranges to select the precision with which they are comfortable answering. The resulting ranges can serve as constraints on the imputation of missing values, as described below. Exhibit range 10 gives figures from the 2009 SCF panel data to illustrate the potential power of collecting data.
Exhibit 10: Percent reporting type of response, 2009 SCF panel interview*
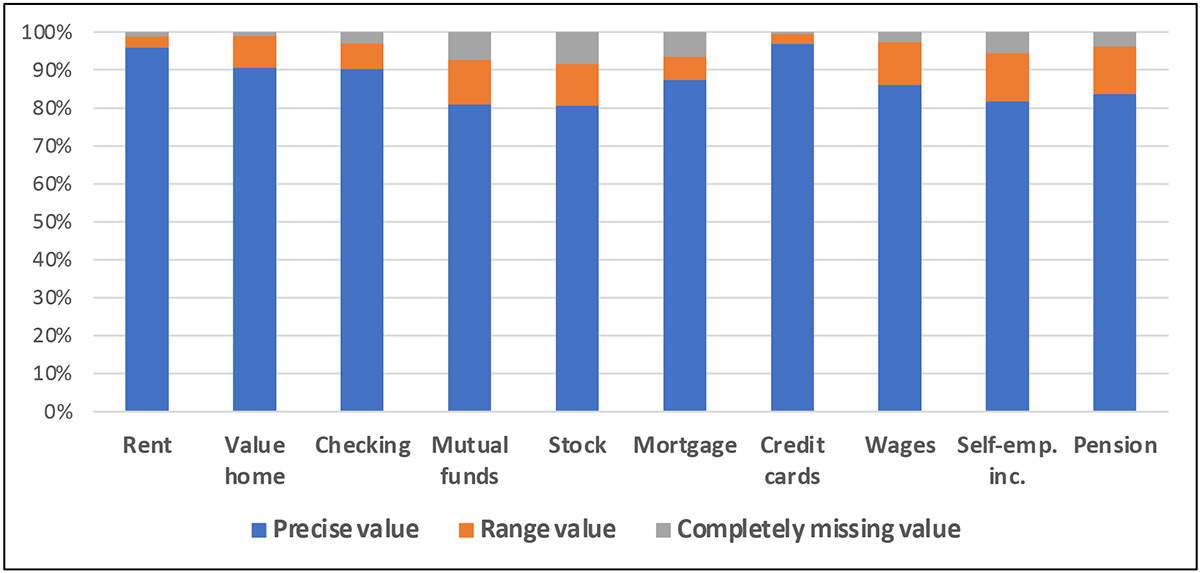
* For each wealth element, the estimates include all respondents who do not answer “no” to a preceding ownership question.
Other powerful tools for supporting accurate responses include making definitions easily available when the respondent has questions, including automated data consistency checks in the computer program used to collect the data, and allowing interviewers (or respondents, in the case of a self-administered questionnaire) to make open-ended clarifying remarks. An important point to take away here is that collecting useful wealth data requires a lot of planning, testing and strategizing about how to deal with less-than-ideal matching of the questionnaire with the level of knowledge and interest of the respondent.
A survey may be mediated by an interviewer in an in-person setting or via phone or other virtual means; it may be conducted by the respondent engaging directly with the questionnaire online, on paper, or some other way; or there may be a hybrid of mediated and self-administered approaches. Arguments against using interviewers include the cost of their labor and the fear of their negatively affecting respondents in giving truthful answers. In addition, interviewers may differ in their skills and thereby introduce unnecessary variability in the data. However, interviewers also have many potential virtues. A well-trained interviewer can act as necessary during the interview to ally respondents’ concerns about providing personal information, they can follow protocols for clarifying questions to respondents and inconsistencies in their answers, and they can encourage respondents to the degree possible to stay engaged and make efforts to provide good data. Where contact information is less than perfect, an interviewer can perform the necessary locating work in the field. My strong bias is that, with rare exceptions, interviewers are essential in maintaining the quality of the complex data collected in wealth surveys.
How should the survey respondents be selected?
Surveys, by definition, collect data from only a part of a population. There is virtually universal agreement that randomization in selecting the sample provides a good way of avoiding the possibilities of bias that might emerge if selection turned on purposeful choices. There is also a highly developed mathematical literature supporting inference from randomized selection; there is no comparably developed structure for dealing with purposive selection. Stratification, or selection of a sample within well-defined subgroups of the population, is frequently used to minimize the likelihood that random sampling might choose “too many” or “too few” elements from some part of the population. Most commonly, geographic strata — often implemented in a multi-stage approach—are used to ensure representation, in a probability sense, across all areas. Where the characteristics of ultimate interest in the survey, for example education level, are distributed broadly and without extremes, this approach can be highly effective and cost-efficient.
Problems may arise when the characteristics of interest are “rare” or there is extreme variation in the population. As a variation on a classic example, consider sampling individual creatures in a room containing a million identical fleas and one elephant weighting as much as a million fleas. Clearly, very many potential samples might contain no elephant, and the average weight estimated from the samples would vary greatly, depending on whether the elephant was selected. For example, for a sample size of 1,000 creatures, the maximum average weight the creatures selected would be 1,000.999 (the average weight of one elephant and 999 fleas); in samples with only fleas, the average would obviously be exactly one. Although no single sample would yield the true population average of slightly less than two flea weights, the average across all potential samples would. In the statistical sense, the estimates would be unbiased, but (highly) inefficient. Although this is a silly example on its own, it captures the essence of why sampling to measure wealth can be difficult.
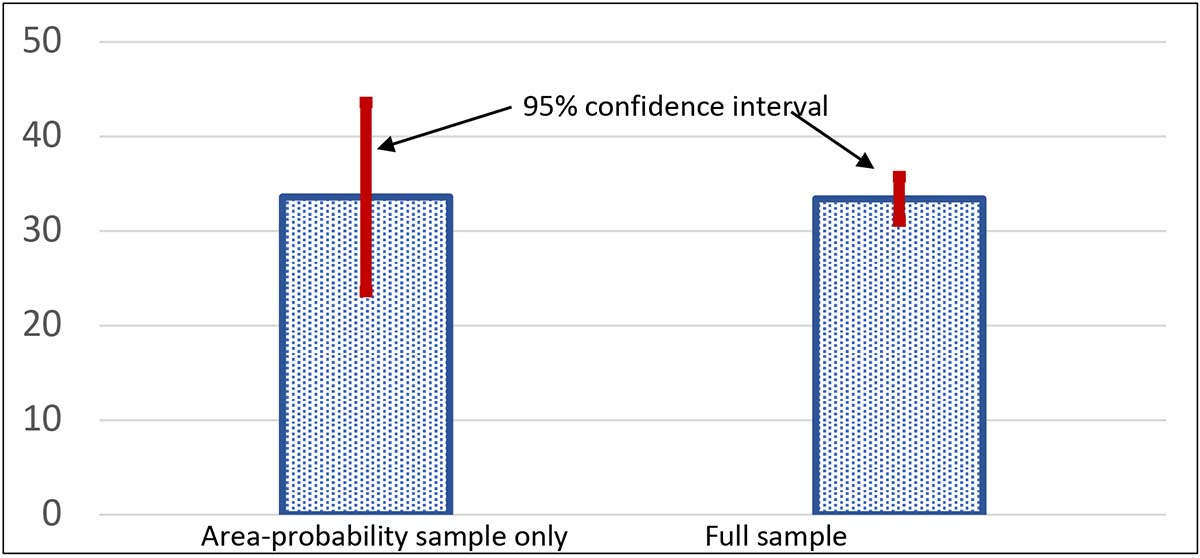
There is abundant evidence that the distribution of wealth is highly skewed, with the very wealthiest households owning a substantial fraction of the total — though the situation is not as extreme as the elephant-and-fleas example. To give insight into the scale of the problem, Exhibit 11 shows a time series of the wealth share of the wealthiest one percent of households, as estimated just from the area-probability sample (a type of geographically stratified random sample) component of the SCF, which makes no special allowance for capturing the wealthy households, and the estimates from the full SCF sample as shown in Exhibit 5 in the first of these posts . In only 2004 does the estimate approximately coincide with the estimate made including the full SCF sample, which includes a special over-sample of wealthy households, as described further below. Moreover, as shown in Exhibit 12, the estimate using only the area-probability sample has a far larger confidence interval for the estimate, so large as to render the estimate nearly useless.. Even more striking, the estimates are highly variable over time. For example, the estimated share using on the area-probability sample increases by almost 15 percentage points between 1998 and 2001 and then falls from 2001 to 2010 by almost 20 percentage points. Wealth swings of that magnitude might be thought large enough to spark some sort of revolution!
Stratifying a survey sample by wealth would clearly be an improvement over a simple area-probability sample, but if one already had such information, it might not be considered necessary to collect the information in a survey. Of course, in such a case one might collect more detailed wealth data and more contextual information. But in practice, the best hope is often to rely on proxies for wealth in sampling. For example, one wealth survey relies on stratification by electricity consumption, and another relies on characteristics of residential properties. For substantial parts of its sample, the “list sample”, the SCF is able to use an arguably closer proxy for wealth for stratification, an estimated wealth level computed using information on income and other characteristics, from statistical records derived from individual income tax returns. Among other things, inclusion of this feature allows the SCF to align closely with aggregate wealth measures and to make a more statistically precise estimate of the wealth share of the wealthiest one percent.
Exhibit 11: Wealth share of wealthiest 1%, estimates from SCF area-probability sample
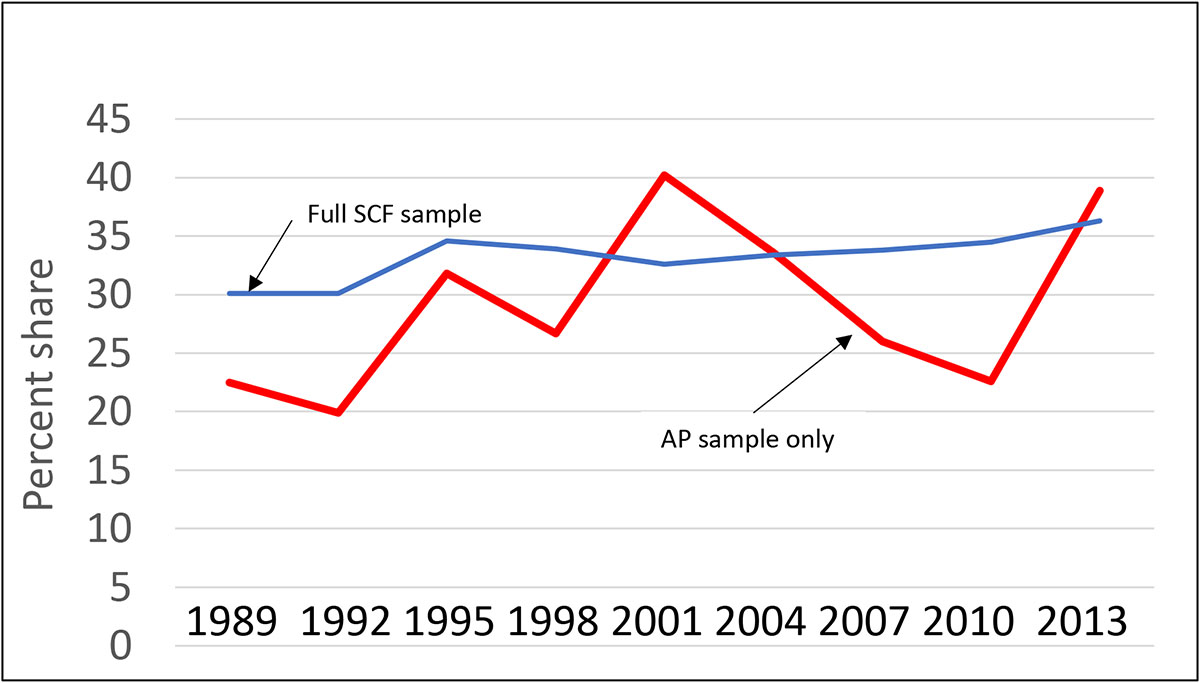
Exhibit 12: 95% confidence interval for 2004 wealth share of wealthiest 1%, SCF
What if everyone does not participate in the survey?
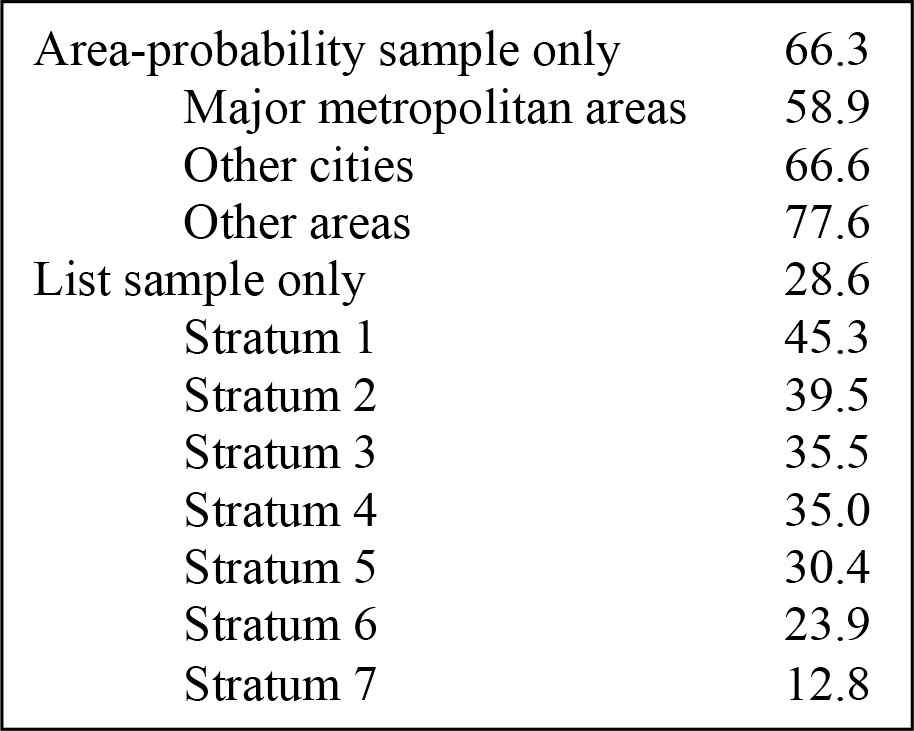
Unlike the case of our assumed willing elephant and fleas, it is usually the case that not every household selected in a sample will agree to participate. There is a variety of informal and formal evidence across surveys that in most instances, relatively wealthy households are less likely to participate in a survey. The high-level sample structure of the SCF can give some insight into this issue. As shown in Exhibit 13, response rates for the area-probability sample alone show that the rate decreases with the degree of urbanization of the location where the cases are located. The list sample for the survey is organized into seven strata corresponding to increasing levels of predicted wealth. Although the first stratum overlaps with the more typical wealth range seen in the area-probability sample, the list sample overall is highly concentrated on the very top of the distribution. The response rates in that sample drop steadily with rising levels of predicted wealth, and comparison of predicted wealth with wealth measured for participants strongly suggests the same is true for actual wealth. Wealthier respondents might be less likely to participate for a variety of reasons: very wealthy people can be very mobile and hard to locate for an interview, particularly for the extremely wealthy they may be surrounded by other people whose job it is to keep everyone else away from them, they may see their time as too valuable to spend completing a long and complicated interview, and/or they may have stronger than average concerns about privacy, etc.
Exhibit 13: Response rates by sample type, 1995 SCF
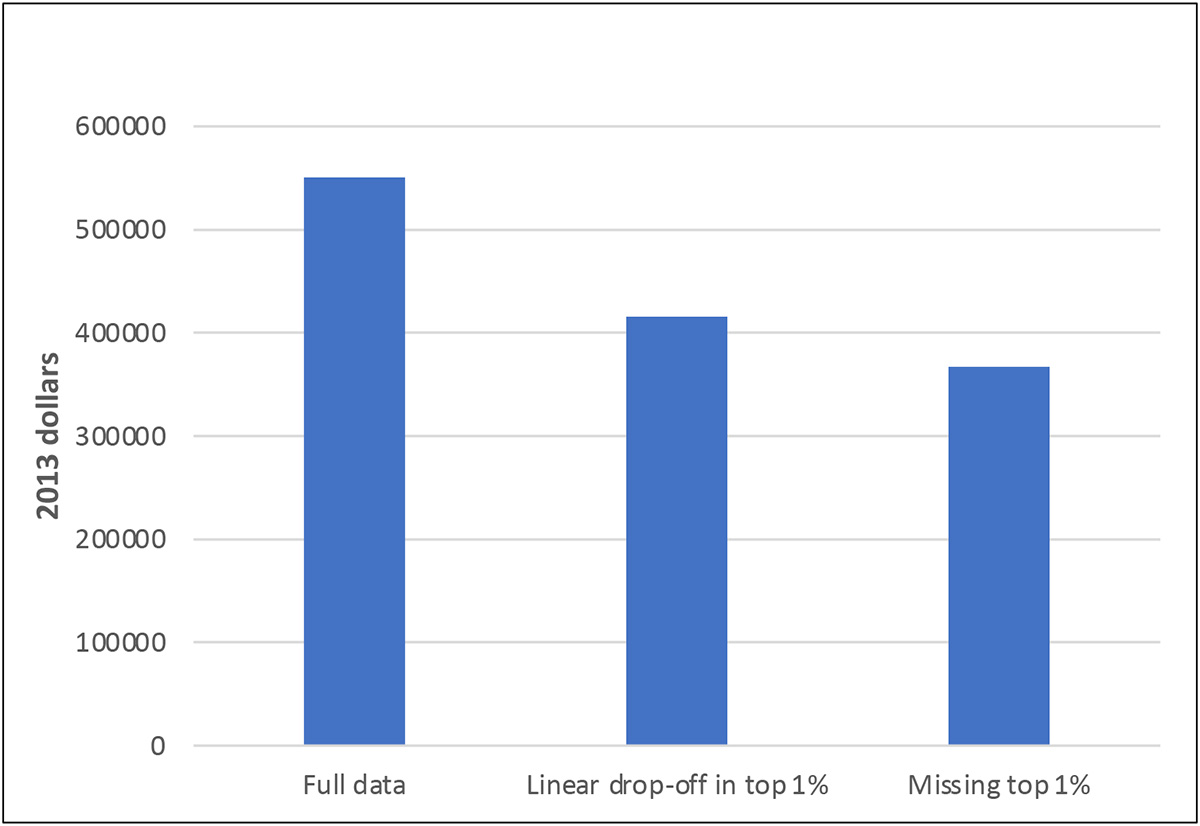
Such differential nonresponse at the top of the wealth distribution effectively imposes an additional stage of sampling, one that reduces the representation of the upper tail of the wealth distribution by some amount. To give a sense of how much difference it can make if such differences cannot be corrected, Exhibit 14 uses final 2013 SCF data to show the effects on estimates of mean wealth of treating some part of the top of the wealth distribution as completely unobserved. While the SCF may not exactly reproduce the true empirical distribution of wealth (among other things, it intentionally excludes people included in the Forbes list of the 400 wealthiest people), it does usually come close to reproducing the aggregate wealth recorded in the national financial accounts. Assuming that the response rate within the top one percent drops off linearly above the 99th percentile to zero at the 100th, the estimated mean declines by more than 20 percent. Omitting the entire top one percent makes only a relatively small additional difference, reflecting in essence the level of concentration of wealth even within the top one percent. Wealth tends to be highly skewed in most countries and imperfect representation of that skewness can have very strong effects on many estimates, especially many that we tend to think of as providing information about the degree of inequality.
Exhibit 14: Effects of sample truncation in estimates of mean, 2013 SCF
Sample surveys almost always include a weight of some sort to provide a measure of the likely representation of each observation in the population. Without nonresponse, the weight is simply the inverse of the probability of selection of each element into the sample. The most standard procedures for adjustments beyond this point include calibration (or post-stratification) of the total weight of various categories to align with reliable figures from other sources, and adjustments for nonresponse. Calibration can help to smooth out some distortions in estimates for important categories. For nonresponse adjustment to have a meaningfully positive effect however, it must have some means of accounting for the aspects of nonresponse that are most important for the analytical purposes of the survey—in the current case, nonresponse with respect to wealth. The SCF is fortunate in having in its sample design an indicator so closely aligned with actual wealth rank that can be used in ex post weight adjustments. In very many other cases, at best only a distant approximation is available. Moreover, in some cases, no amount of weight adjustment can compensate for the fact that there are no or too few wealthy cases among the participants to work with meaningfully. Because differences in the effective coverage of the upper tail of the wealth distribution can matters so much for tail-sensitive estimates related to inequality, great caution is recommended in comparing such estimates across surveys, and in some cases even across waves of the same survey.
Surveys usually also provide some means of quantifying the range of potential estimation error due to the fact that estimates are based on a sample, not the whole population. Often, these methods operate by selecting a number of subsamples from actual data, according to specific protocol, and characterizing the variability of estimates across those subsample. Perhaps the simplest to understand conceptually is a type of bootstrap resampling that uses the original stratification dimensions of sample selection as strata for resampling. Estimates of the distribution of sampling variability can be made by performing the estimation on each subsample, with perhaps a correction appropriate to the particular subsampling methodology.
What should be done if reported values are obviously incorrect?
A key part of the processing of survey data is the inspection of the data for inconsistencies. A respondent may have misunderstood a question, lacked motivation or ability to respond correctly, or had other concerns about the confidentiality or other aspects of the legitimacy of the survey. The interviewer may have read the question incorrectly or have lacked the motivation or ability to make the question clear to the respondent. Alternatively, the question wording may have been ambiguous in the context of the respondent’s situation, the underlying concepts in the question may have shifted, or the respondent’s situation may have been too complicated to fit into a questionnaire structure that cannot be flexible enough to adapt to every possible situation. The last point is one that is sometimes glaringly obvious for extremely wealthy respondents, who may have complex assets or debts of types that most people would at best only have heard about.
At a minimum, the data structure must be coherent at the level of the logic of the questionnaire. For example, there should be no value reported for an item that the data also indicate does not exist—one or the other (or both) must be incorrect. Often, editing goes substantially further, encompassing such relationships as requiring the date a mortgage was taken out to be at least the same year as the year the associated property was purchased. Sometimes it is “obvious” that a respondent has reported, or an interviewer has recorded, an item with an incorrect number of trailing zeroes. Subsidiary information may also inform such decisions. Where relevant administrative data, for example, are available, it may be possible to detect more types of reporting error. Where the questionnaire enables interviewers to record comments about the progress of the interview, it may also be possible to disentangle some aspects of confusion that occurred during the interview. The deeper editing goes, however, the more it inevitably becomes subjective. For that reason, best practice requires that at least a strong preponderance of evidence should support any change to the data. It is important to underscore the fact that the need to edit is an expression of failure in the data collection process. Given the heterogeneity of respondent types and the complexities of real data, some degree of failure is probably inevitable. But a healthy repeating survey must channel the knowledge acquired from editing into consideration of future questionnaire changes and protocols for data collection.
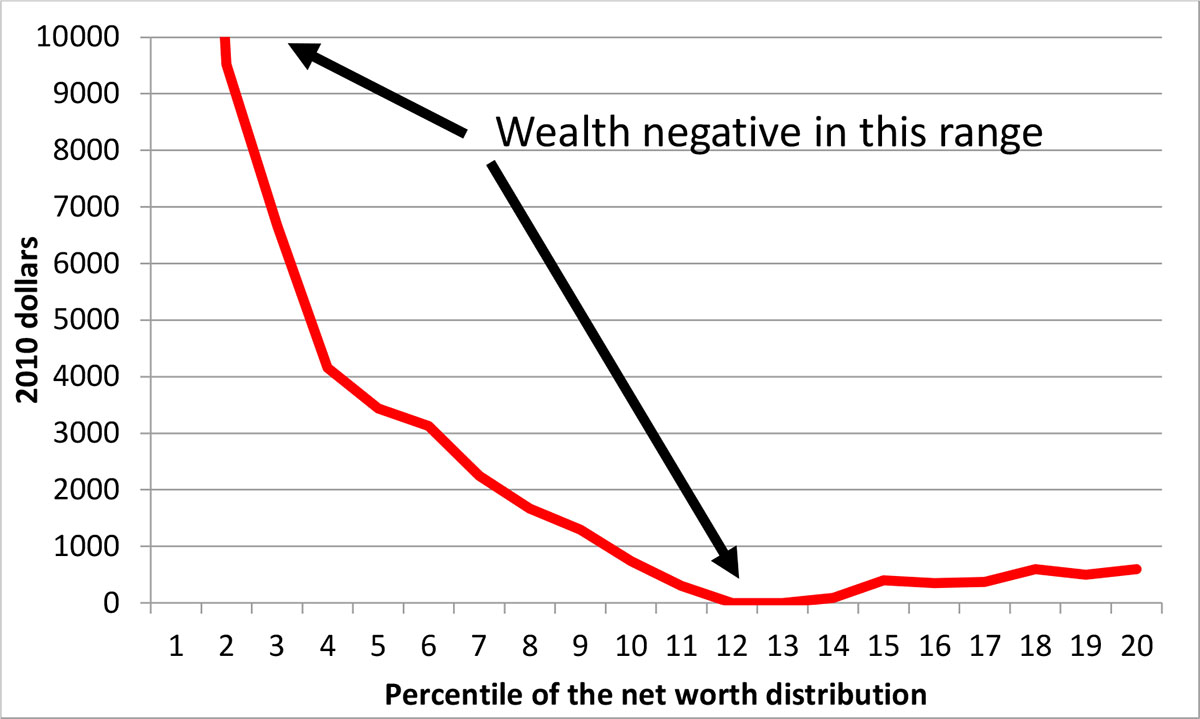
The seriousness of paying attention to the effects of editing is highlighted by the estimates displayed in Exhibit 15 and Exhibit 16, using data from the 2013 SCF. For the estimated wealth distribution above the 20th percentile, Exhibit 15 shows the increase in the percentile estimates as a result of editing, as a fraction of the edited value. Although the change is relatively small around the median, it is notably larger elsewhere in the exhibit. The part of the distributions below the 20th percentile is shown separately as simple changes in numerical levels in Exhibit 16, because relatively small numerical changes closer to zero wealth would make the changes difficult to display as percent changes and the negative values below that might be confusing in this context.
Exhibit 15: Estimated change in the distribution of wealth, (edited data-unedited)/ABS(edited data), 2010 SCF
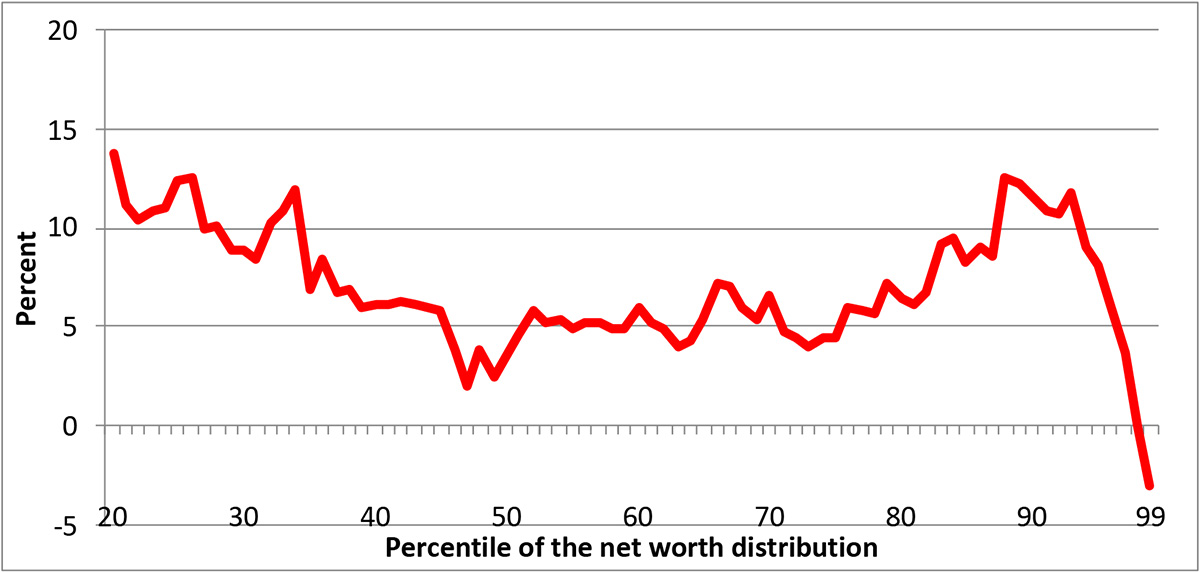
Exhibit 16: Estimated change in the distribution of wealth, edited data-unedited, 2010 SCF
What if the interview is with the wrong person or it is entirely fabricated?
In uncommon instances, the information used in locating a respondent for a survey is insufficient on its own to identify the correct person or location as determined by the sampling process. Where no action is taken to obtain more information, the wrong person may be interviewed. My favorite example of this was a case where the literal gatekeeper at a substantial estate was interviewed, rather than the selected respondent who lived in the house in the middle of the property. Detecting such errors can be difficult, though advances in location technology and in other areas have made it less likely. Following the correct people in panel surveys raises similar issues, which are not addressed specifically here.
A problem both more troubling and more difficult to detect is fabrication of partial or entire interviews. Sometimes an interviewer will gain some information from a legitimate respondent and embroider the remainder of the interview, based on that limited information. Other times, an entire interview is fabricated. Almost all interviewers have proven to be honest and reliable, but there are sometimes a very small number who are not. Unfortunately, that small number can sometimes evade detection long enough cause significant damage. Although there have been some advances in the use of technology, statistics and computer science in identifying such fraudulent data, the best practice remains recontacting a subset of respondents for each interviewer in an attempt to validate whether a legitimate interview was conducted. Where any case is found to be fraudulent, under this protocol every other case completed by the interview is also treated, and where it is not possible to recontact the respondent, the case must be discarded.
What happens if participants do not answer some questions?
Unfortunately, it is seemingly inevitable that some participants will not want to or be able to answer some questions. Even when the strategy discussed above for collecting range information for numerical amounts in such cases, there is still the question of how to treat the range. In the past, it was a much more common practice simply to drop observations with missing data in fields relevant for a given analysis. This practice poses two serious risks. First, unless the presence of nonresponse is unrelated to the analysis, there is the possibility of bias in resulting estimates. For example, in a wealth survey, people with more complex financial arrangements have more “opportunity” to have missing data, potentially causing complete-case analysis of the wealth distribution to be flawed. Second, if multiple analyses involving different variables are done with the data, there is the possibility that the populations selected for the analyses will differ in ways that invalidate relationships between the estimates. To a growing extent over the past 40 years, imputation of missing values has become more widely accepted for data intended for research.
Imputation may take many forms. So-called hot deck methods have long been practiced, especially in large-scale data collection for official statistics. This method involves finding “donor records” that align along some dimensions with records with missing information and using the data in the donor record to fill in the missing data. The advantage of this approach is that it can be implemented in a relatively simple, automated way. The principal disadvantage is that the number of dimensions of alignment is typically quite small. This limitation is potentially a very important problem when the data are intended to be used for multivariate modeling, where correlations across variables are important; it may also make an important difference in descriptive estimates, such as wealth concentration ratios, if the alignment variables are not strongly correlated with wealth or the observed pattern of missing data is correlated with the variable to be imputed. Filling in missing values with the mean of the observed distribution, usually conditional on at most a few characteristics, was once common in research. But this approach artificially inflates the measured precision of estimates and suffers from some of the same problems as the hot deck methods as a result of the limited set of conditioning variables. Broader, model-based procedures, typically based on regression models of some sort, have been used to estimate conditional means with broader conditioning, and those values together with a draw from the estimated error distributions of the models serve as the imputations. This approach propagates the covariance structure inherent in the estimated model. As in the other approaches discussed, it is still possible for the resulting imputations to be biased if the patterns of missingness are correlated with the variables to be imputed, but the hope is that broad conditioning sufficiently mitigates this problem. Multiple imputation, in essence a version of model-based imputation applied to generate more than one draw from the estimated conditional distribution, has become close to the standard for wealth surveys, given its application in the SCF and the Household Finance and Consumption Survey, an umbrella for country-level surveys in the Eurozone and a few other European countries. Multiple imputation supports more efficient estimation than single imputation, by allowing averaging across multiple estimates, and it makes it possible to estimate the uncertainty inherent in the fact that the values are imputed, not actually reported values.
A best practice is to flag imputations in the published data set to indicate at a minimum whether the values in it are ones originally reported by the respondent or ones imputed during the processing of the data for publication. Where possible, each flag should also indicate whether range information was used to support an imputation, the original value was treated as unreliable and imputed, or the data field is not applicable in light of previous data logic.
What holds the system of data collection together?
From the part of survey operations discussed here (and there is much more), it should be clear that it is a process with potential for complexity. Although there are some important elements of direct central coordination—questionnaire construction, sampling, training, etc. — much operates on a decentralized level. Creating the necessary systems and, more importantly, the culture of values to coordinate people in their actions is essential, if quite difficult. Collecting wealth data is widely believed to present the most difficulties. I hope everyone who uses survey data on wealth will take a moment to think of the many people who needed to act together to make the data collection process work and to the respondents who provided the data, without which the whole thing would be only a very expensive empty exercise.
What does the future look like?
Costs of interviewer-mediated surveys have risen over time, and in some cases to levels that are high enough to be very worrisome. Explaining a significant part of this trend is the increasing difficulty of persuading people to participate in surveys and provide meaningful information on a subject as sensitive as household finances. Rising costs and threats to information quality together pose serious risks to continuing to collect wealth data.
It has become increasingly common to make at least some use of administrative data in assembling and analyzing data on individual wealth. This approach may help to address both cost and data quality issues. Such data on their own rarely contain detailed information other than pure balance-sheet data that is needed to analyze wealth and wealth inequality, though some focused research would of course be possible. As noted earlier, some Nordic countries obtain most wealth information for analytical purposes from national registries and use surveys to fill in the necessary supporting detail. Maintenance of such registries may go too strongly against the cultural grain of many countries to be practical. Nonetheless, even partial information, such as data from tax-administration systems or credit registries may be very helpful in identifying and ameliorating response and reporting gaps in surveys. There have also been attempts to use commercially based data, including information in personal finance software systems, to study aspects of wealth. Such systems may be useful for this purpose, but for results to apply to any population other than the population actually analyzed, the data system must have a structural or well-defined probabilistic connection to the target population for the analysis.
For supporting more complex issues in inequality research, more and better information on broader time spans, including intergenerational relationships, is needed. Much creativity, and probably substantial resources, will be needed to make progress in this direction.
Read More by Arthur B. Kennickell:
- Wealth, Inequality, and Measurement, and the GC Wealth Project Website: Arthur B. Kennickell
- What Do We Mean by Wealth Inequality? A Framework by Arthur B. Kennickell
- Stone Center Working Paper Series. no. 37: Chasing the Tail: A Generalized Pareto Distribution Approach to Estimating Wealth Inequality
- Blog Post: What Do the Recent Survey of Consumer Finances Data Show about the Recovery from the 2008 Crisis?